
Fig. 7
- ID
- ZDB-IMAGE-080326-48
- Genes
- Publication
- Hegde et al., 2008 - Genomewide Expression Analysis in Zebrafish mind bomb Alleles with Pancreas Defects of Different Severity Identifies Putative Notch Responsive Genes
- All Figures
- Figures for Hegde et al., 2008
|
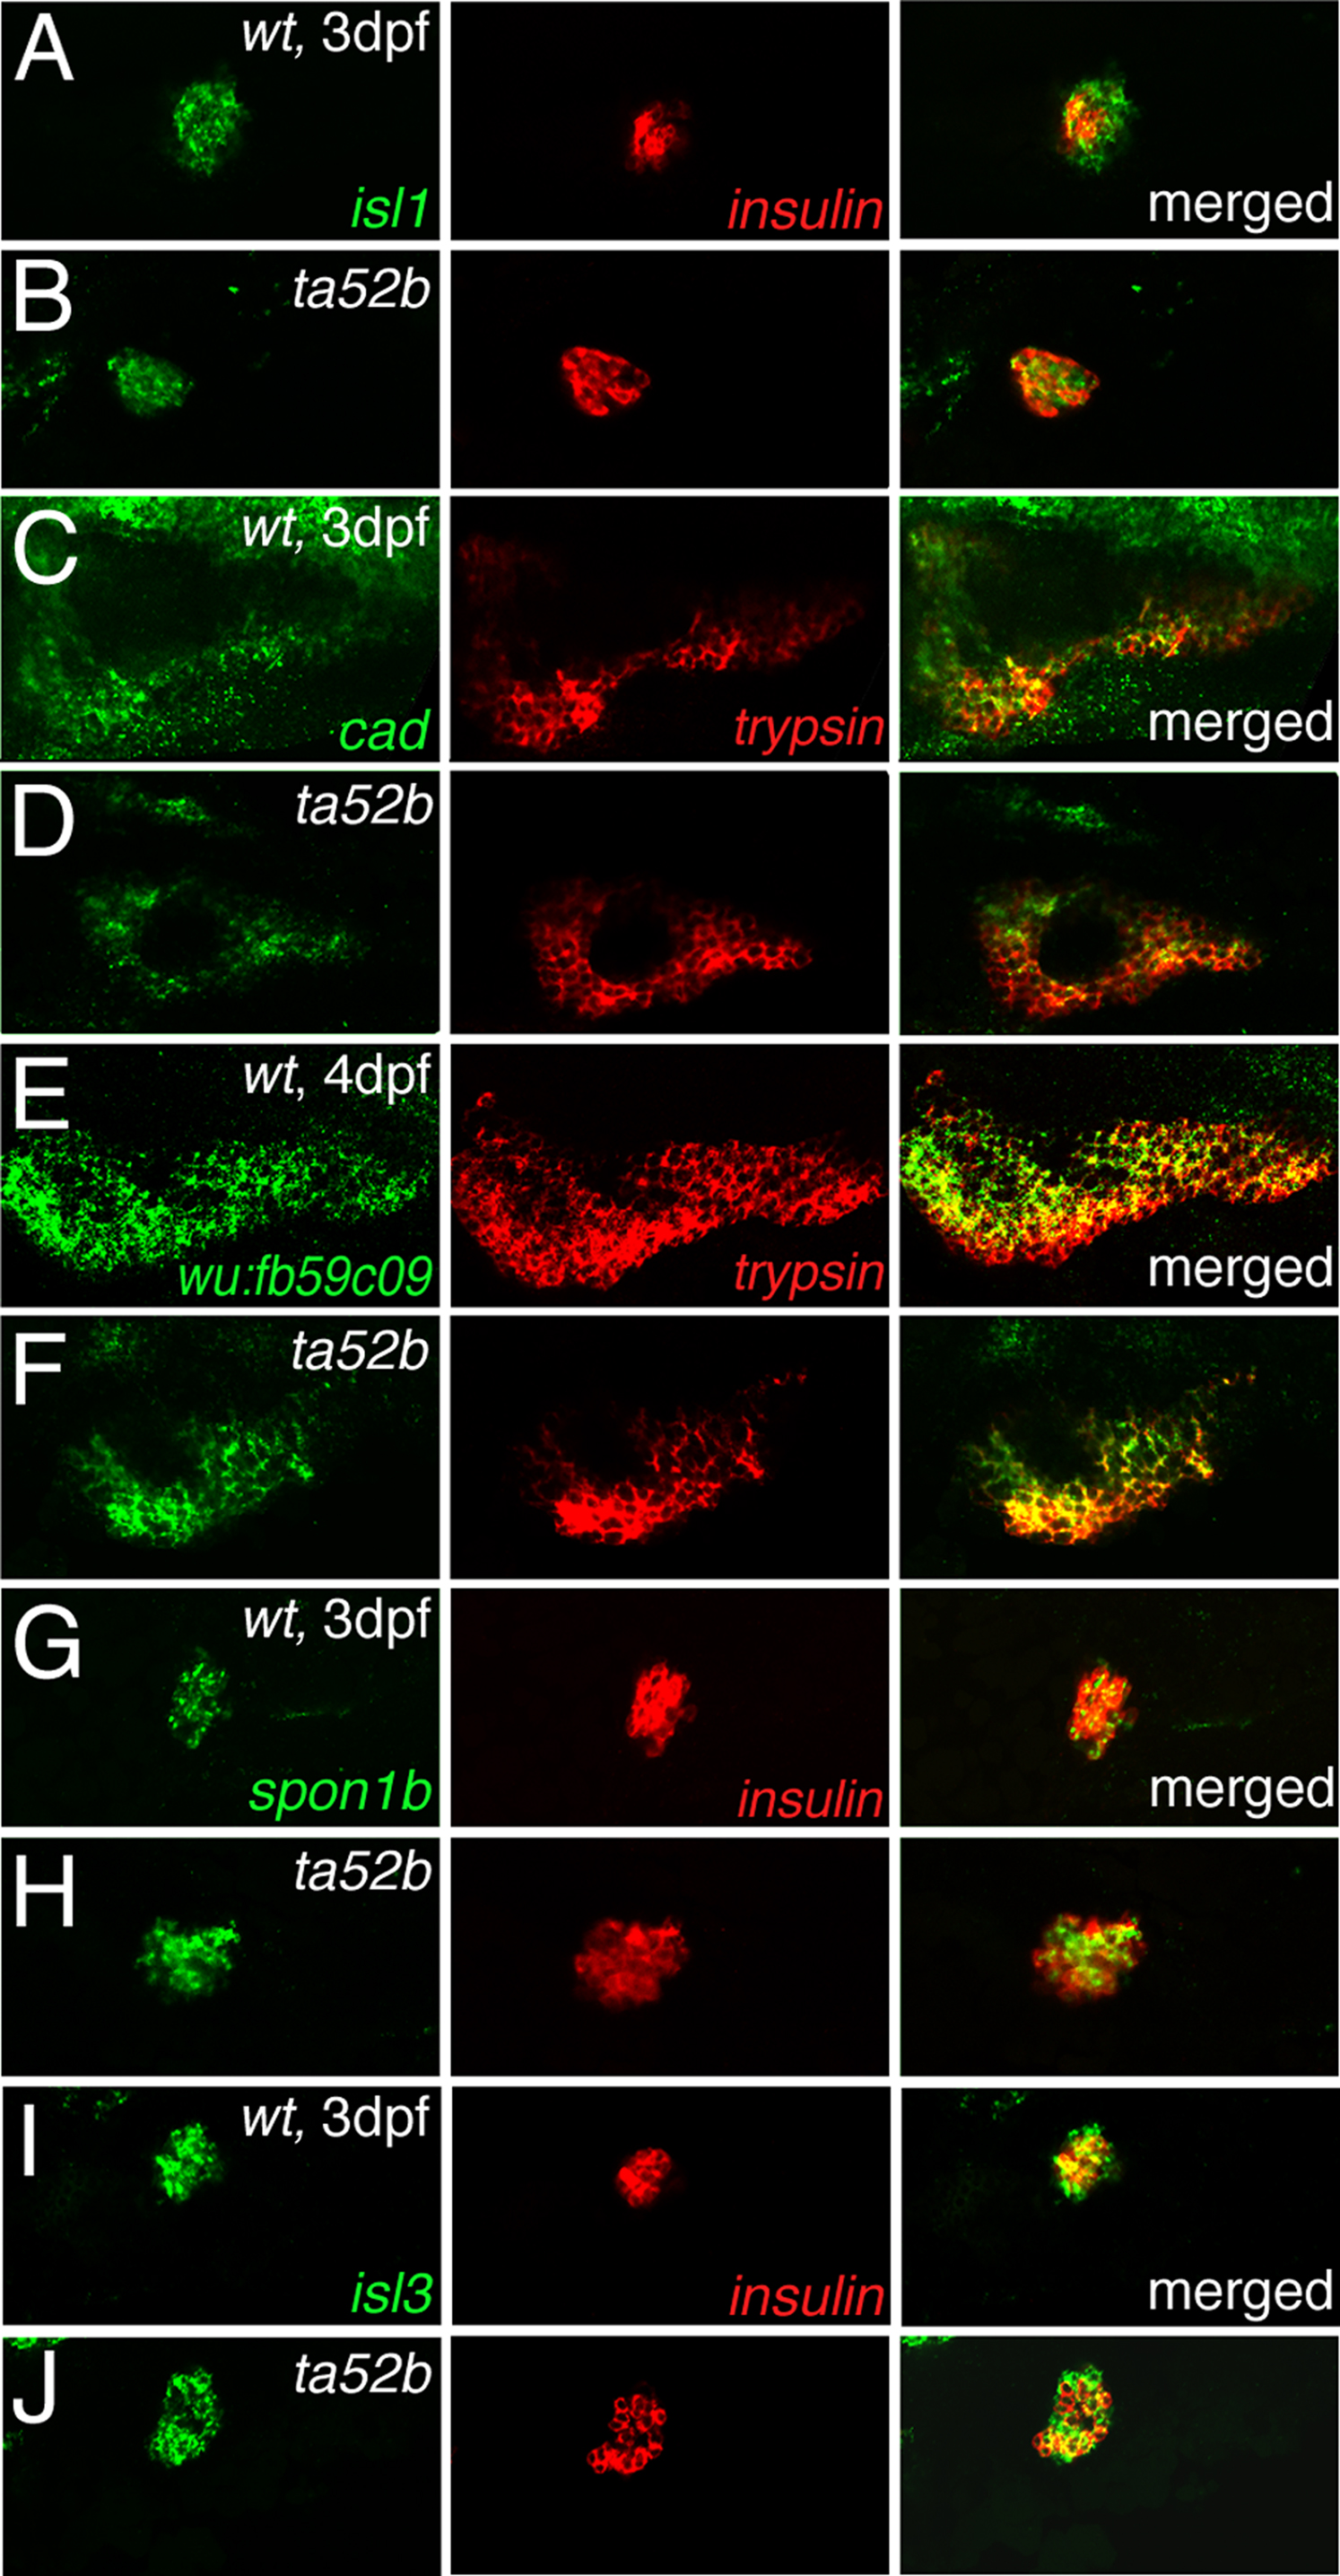
Fig. 7 Validation of expression profile of differentially expressed genes with fluorescent double in situ hybridization. Expression of down-regulated genes: (A and B) isl1, (C and D) cad and (E and F) wu:fb59c09 and up-regulated genes: (G and H) spon1b and (I and J) isl3 in (B, D, F, H and J) mibta52b mutants embryos and (A, C, E, G and I) wild-type embryos. Left panels show respective gene expression in green; middle panels show insulin (endocrine) or trypsin (exocrine) expression in red; right panels show merged pictures. Expression of wu:fb59c09 is shown in 4-dpf embryos, and the rest are in 3-dpf embryos. All embryos are anterior to the left and ventral views.