
IMAGE
Fig. 8
- ID
- ZDB-IMAGE-071004-126
- Genes
- Publication
- Dooley et al., 2005 - Zebrafish scl functions independently in hematopoietic and endothelial development
- All Figures
- Figures for Dooley et al., 2005
Image
|
Figure Caption
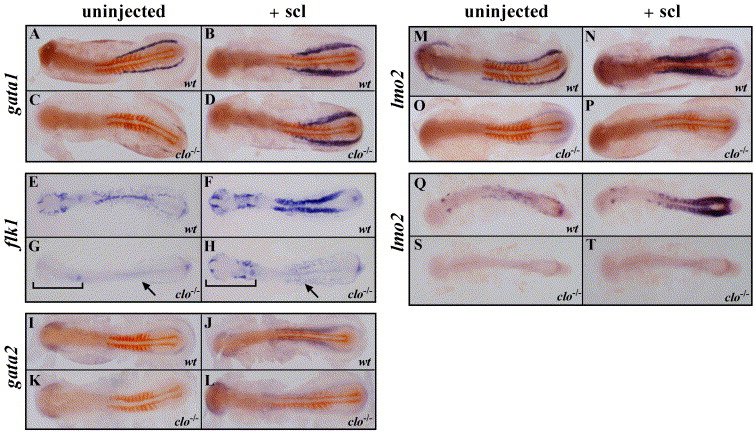
Fig. 8 Analysis of hematopoietic and endothelial expansion in clo in response to forced expression of scl. Double ISH (A–D, I–P) using myoD in red and gata1, gata2, or lmo2 in blue, or single ISH using flk1 (E–H) or lmo2 (Q–T), in wild-type and clo-/- embryos injected with scl RNA (+scl) or uninjected controls, as indicated. In G, H, brackets indicate anterior endothelial cells, and arrows indicate posterior lateral mesoderm. In I and J, arrowhead indicates expression of flk1 in the tail bud. Embryos are between the 10- and 12-somite stage (A–P) or the 20 somite stage (Q–T).
Figure Data
Acknowledgments
This image is the copyrighted work of the attributed author or publisher, and
ZFIN has permission only to display this image to its users.
Additional permissions should be obtained from the applicable author or publisher of the image.
Reprinted from Developmental Biology, 277(2), Dooley, K.A., Davidson, A.J., and Zon, L.I., Zebrafish scl functions independently in hematopoietic and endothelial development, 522-536, Copyright (2005) with permission from Elsevier. Full text @ Dev. Biol.