
IMAGE
Fig. S3
- ID
- ZDB-IMAGE-070917-40
- Genes
- Publication
- Stewart et al., 2006 - Zebrafish foxd3 is selectively required for neural crest specification, migration and survival
- All Figures
- Figures for Stewart et al., 2006
Image
|
Figure Caption
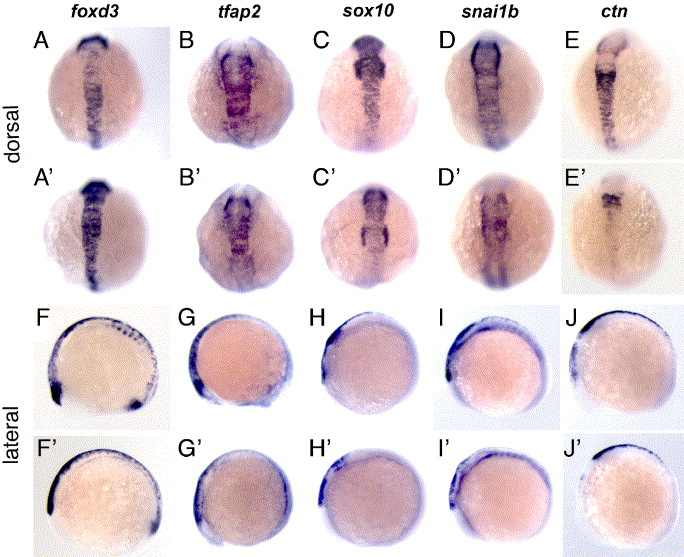
Fig. S3 Gene expression abnormalities in premigratory neural crest populations in sym1 mutants. Dorsal (A–E, A2–E2) and lateral (F–J, F2–J2) views of neural crest expression of foxd3, tfap2a, sox10, snai1b and ctn in 10-somite stage wild-type (A–J) and sym1 mutant (A2–J2) embryos. The neural crest expression of sox10, snai1b and ctn is reduced in sym1 mutants. tfap2a expression is indistinguishable between mutant and wild-type embryos. Neural crest expression of foxd3 appears to be increased in sym1 mutants compared to wild-type embryos.
Figure Data
Acknowledgments
This image is the copyrighted work of the attributed author or publisher, and
ZFIN has permission only to display this image to its users.
Additional permissions should be obtained from the applicable author or publisher of the image.
Reprinted from Developmental Biology, 292(1), Stewart, R.A., Arduini, B.L., Berghmans, S., George, R.E., Kanki, J.P., Henion, P.D., and Look, A.T., Zebrafish foxd3 is selectively required for neural crest specification, migration and survival, 174-188, Copyright (2006) with permission from Elsevier. Full text @ Dev. Biol.