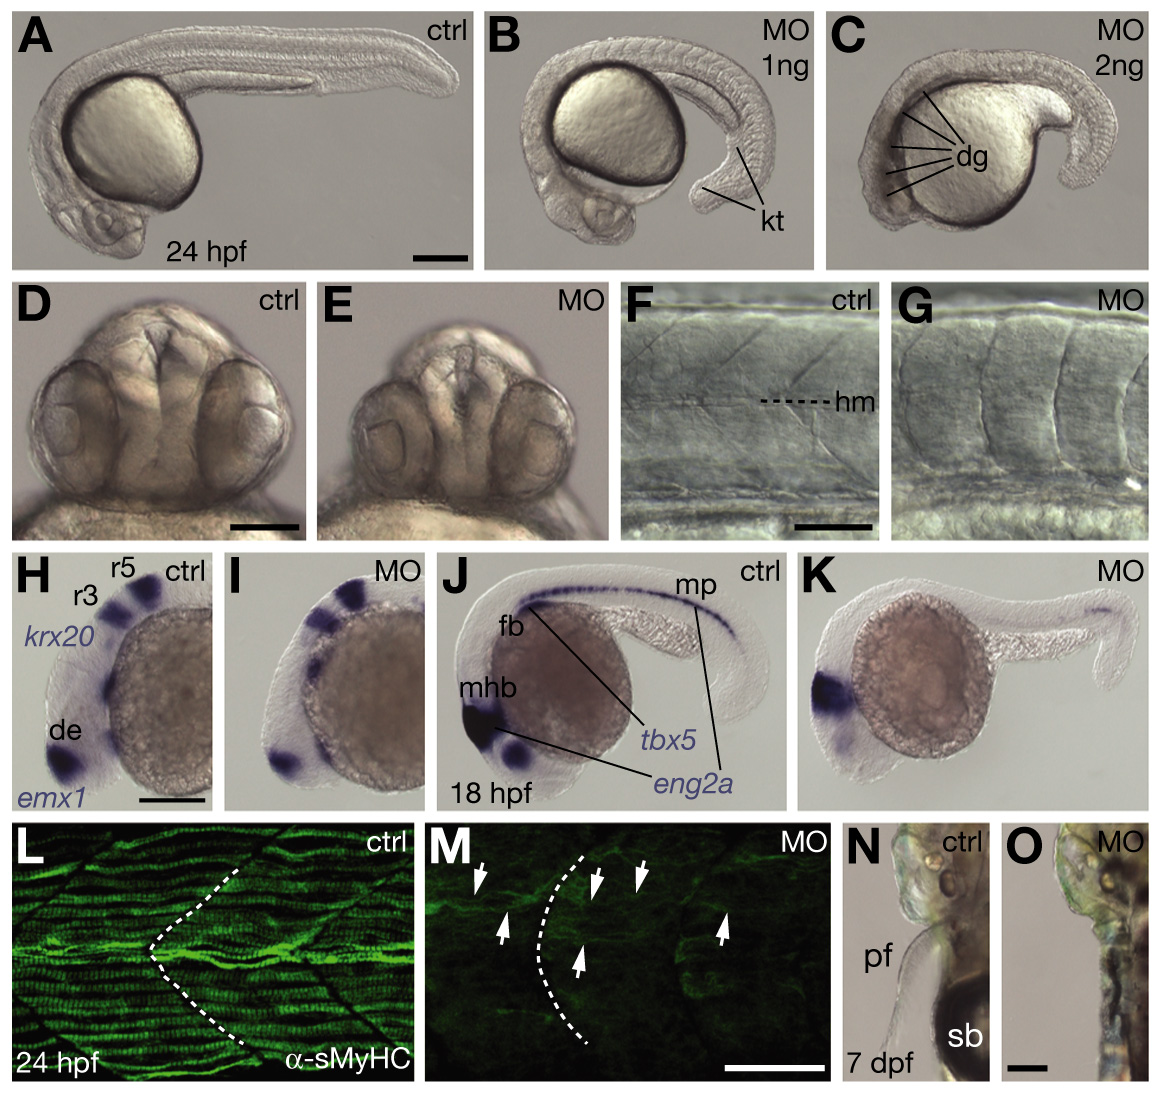
Fig. S1 Effects of interference with Prdm1 activity on embryonic morphology, slow muscle and pectoral fins. (A-C,F-M) Lateral view, anterior towards the right. (D,E) Frontal view, dorsal towards the top. (N,O) Dorsal view, anterior towards the top, left side shown. (A,D,F,H,J,L,N) Untreated controls (ctrl). (B,C,E,G,I,K,M,O) Embryos microinjected with 1 ng of MOprdm1 oligonucleotides (MO). (A-C) Overall morphology at 24 hpf; embryo in B scored as strong phenotype with kinked tail (kt); embryo in C scored as severe phenotype exhibiting degeneration in head and trunk (dg; embryos of that class were not subjected to molecular anlyses). (D,E) Head morphology at 24 hpf. (F,G) Morphology of three somitic segments at 24 hpf; somites are U-shaped and lack horizontal myoseptum (hm, broken line) in morphants morphants as seen in ubotp39 mutant embryo. (H,I) emx1 expression in diencephalon (de) (Morita et al., 1995), but not krox20 expression in hindbrain rhombomeres 3 and 5 (r3, r5), is slightly reduced at 24 hpf. (J,K) eng2a expression at the mid/hindbrain boundary (mhb) (Ekker et al., 1992) is normal and reduced in muscle pioneers (mp) in 18 hpf morphants. tbx5 expression in prospective pectoral fin buds is missing (fb) (Begemann and and Ingham, 2000). (L,M) Slow muscle fiber formation, detected by a-sMHC antibody (mAB F59) (Crow and Stockdale, 1986), is severely affected in morphants (white arrows), as observed in ubotp39 mutant embryo (Baxendale et al., 2004), and the level of sMHC protein expression is low (image overexposed); broken line highlights somite boundaries; Cy2-conjugated secondary antibodies by Jackson ImmunoResearch were used, photographed using a Zeiss LSM510 inverted confocal laser scanning microscope. Seventy-five percent of morphants (n=51) displayed 0-50% of labeled slow muscle fibres compared with 17% (n=60) when co-injected with 50 pg of prdm1mut RNA. (N,O) Loss of pectoral fins (pf) and failure of swim bladder (sb) inflation. Scale bar: 200 µm in A,I,P,Q,T; 100 µm in D,O; 50 µm in F,M.
Image
Figure Caption
Figure Data
Acknowledgments
This image is the copyrighted work of the attributed author or publisher, and
ZFIN has permission only to display this image to its users.
Additional permissions should be obtained from the applicable author or publisher of the image.
Full text @ Development

