
FIGURE
FIGURE 4
- ID
- ZDB-FIG-260720-11
- Publication
- Perone et al., 2026 - Aip mutation leads to significant alterations in gene expression, altered sensitivity to Ahr ligands, and early lethality in zebrafish
- Other Figures
- All Figure Page
- Back to All Figure Page
FIGURE 4
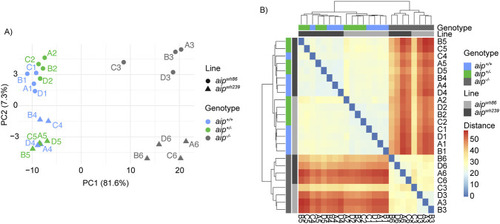
PCA plot (A) and sample–sample distance heatmap (B) of all 24 five dpf RNA-seq samples with sample ID. PCA was performed on the 500 most variable genes across the samples using variance-stabilizing transformed (VST) counts. The sample-sample distance heatmap was generated using Euclidean distances computed from the VST counts and grouped via hierarchical clustering. Both plots show the different lines and, to a greater extent, the aip−/− samples cluster separately. |
Expression Data
Expression Detail
Antibody Labeling
Phenotype Data
Phenotype Detail
Acknowledgments
This image is the copyrighted work of the attributed author or publisher, and
ZFIN has permission only to display this image to its users.
Additional permissions should be obtained from the applicable author or publisher of the image.
Full text @ Front Toxicol