
FIGURE 1
- ID
- ZDB-FIG-260626-12
- Publication
- Rezi et al., 2026 - ZDHHC5 interacts physically and functionally with DLG1 at primary cilia and regulates ciliary length and kidney morphology
- Other Figures
- All Figure Page
- Back to All Figure Page
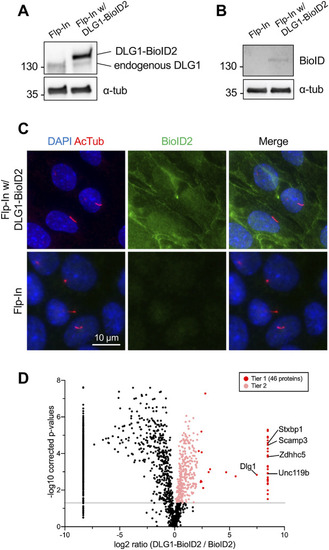
Validation of IMCD3 cells stably expressing rat DLG1-BioID2. (A,B) Western blots of IMCD3 Flp-In cell lines without (Flp-In) or with stable expression of rat DLG1-BioID2. Blots were probed with antibodies against DLG1 (A) or BioID2 (B) as well as α-tubulin (α-tub), which serves as loading control. Molecular mass markers are shown in kDa to the left of the blots. (C) IFM analysis of the indicated IMCD3 Flp-In cell lines following 48 h of culture in supplement-free medium and staining with antibodies against acetylated α-tubulin (AcTub; red), which marks the cilium, and BioID2 (green). Nuclei were stained with DAPI. (D) Volcano plot displaying differential protein interaction between DLG1-BioID2 and BioID alone. Logarithmic ratios are plotted against the negative logarithmic P-value of a Student’s t-test. Proteins are coloured according to their significance tier, and selected Tier 1 candidates are indicated. Proteins with infinite logarithmic ratios (median value in one set equal to 0) were forced to be one order of magnitude above or below the maximum or minimum ratios respectively. |