
Figure 5
- ID
- ZDB-FIG-260530-206
- Publication
- Mencacci et al., 2026 - Pathogenic variants in BORCS5 Cause a Spectrum of Neurodevelopmental and Neurodegenerative Disorders with Lysosomal Dysfunction
- Other Figures
- All Figure Page
- Back to All Figure Page
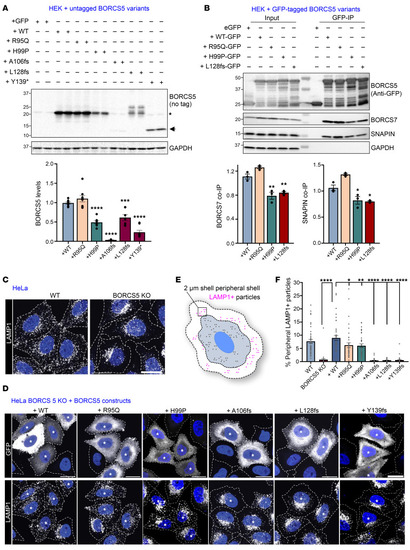
Impact of BORCS5 pathogenic variants on BORCS5 protein expression, BORC assembly, and endolysosome distribution in cell lines. (A) Western blot analysis of BORCS5 protein in HEK293T cells 24 hours after transfection with constructs expressing GFP (control) and BORCS5 WT or the indicated BORCS5 patient variants. GAPDH was used as a loading control. For WT and R95Q/H99P, the band indicated by * was quantified, whereas the band indicated by an arrow was quantified for A106fs and Y139*. In the case of L128fs, the entire band pattern was measured. The 25 kDa band present in the case of A106fs and Y139* variants correspond to endogenous BORCS5, as shown in GFP-only condition. The graph shows the mean ± SEM of fold change over the mean of the WT variant (n = 4 independent experiments). For BORCS5 levels, 1-way ANOVA F(5,41) = 59.49 (P < 0.0001) with Dunnett’s post hoc test compared with WT. ***P = 0.0001, ****P < 0.0001. (B) GFP trap precipitation of GFP-tagged BORCS5 variants and their interaction (co-IP) with endogenous SNAPIN and BORCS7, with GAPDH used as a specificity control. The graph shows mean ± SEM n of 3 independent experiments. For BORCS7, 1-way ANOVA with Dunnett’s post hoc test F(3,8) = 33.17 (P < 0.0001). **P ≤ 0.003. For SNAPIN, F(3,8) = 26.53 (P = 0.0002). *P < 0.018. (C and D) Immunofluorescence microscopy shows endogenous LAMP1 puncta (white) distribution in untransfected WT and BORCS5 KO HeLa (as control) or BORCS5-KO HeLa cells transiently cotransfected with BORCS5 constructs and GFP (* indicates GFP+ cells). Nuclei were labeled with DAPI (blue), and cell edges were outlined by fluorescent phalloidin (dashed lines). Scale bars: 20 μm. (E and F) Schematic depicts LAMP1+ endolysosomes present in a 2 μm peripheral shell, shown in the graph as mean ± SEM for 3 independent experiments, each dot representing a different cell. For peripheral lysosomes, 1-way ANOVA with Dunnett multiple comparisons test (compared with the WT construct), F(7,289) = 30.96 (P < 0.0001). *P < 0.05, **P = 0.0098, ****P < 0.0001. |