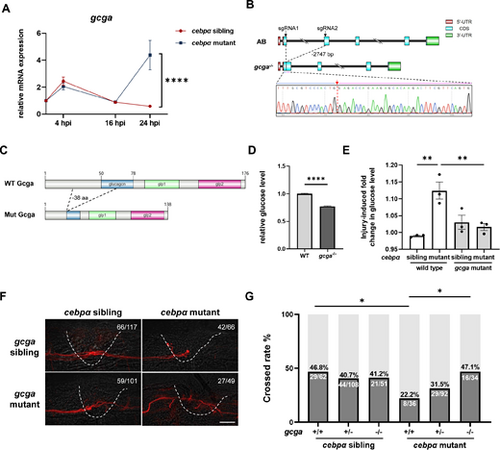
Gcga mutation rescues regeneration defects in cebpα mutant. (A) Relative expression levels of gcga mRNA at 4, 16 and 24 hpi in cebpα siblings and mutants. Statistical data were obtained from three independent experiments. Data were analysed by two-way ANOVA. Error bars represent means ± s.e.m. * A statistically significant difference in the post-injury change in mRNA expression between cebpα mutants and siblings at 24 hpi. (B) Schematic and sequencing results of the deletion in gcga mutants. The light blue region represents the sequence left of sgRNA1, the light pink region represents the sequence right of sgRNA2 and the red arrow and dashed line indicate the deleted region. (C) Schematic of the gcga mutant protein, highlighting the deleted region. (D) Glucose level of gcga mutant relative to wild-type at 4 dpf. Error bars represent means ± s.d. Data were analysed by an unpaired t‐test. Data are representative of three independent experiments with similar results. (E) Relative glucose levels of gcga; cebpα double mutants and their siblings at 48 hpi. This graph combines data from three biological replicates. (F,G) Representative images (F) and quantification (G) of the proportion of larvae with axons successfully crossing the injury site in gcga; cebpα double mutant at 48 hpi. Data were analysed by the chi-square test. Scale bar = 50 µm. White dashed lines outline the analysed region. ****p < 0.0001; **p < 0.01; *p < 0.05.
|
