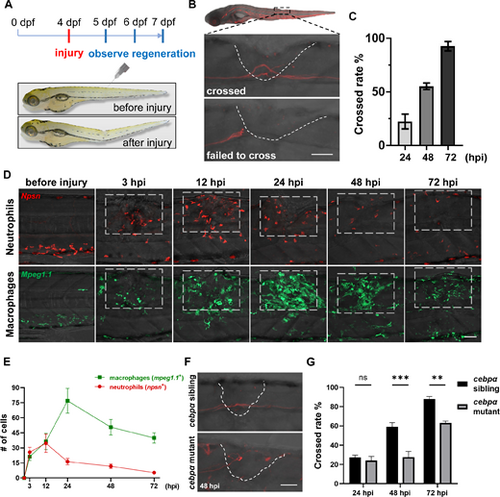
M-cells of myeloid cell-deficient zebrafish exhibit severe axonal regeneration defects. (A) Schematic of the axotomy procedure. (B) Representative images of M-cells stained with anti-3A10 antibody at 48 hpi. White dashed lines indicate the injured area. (C) Quantification of the proportion of larvae with axons successfully crossing the injury site. Statistical data were obtained from three independent experiments: in total, 50, 97 and 51 larvae were analysed at 24, 48 and 72 hpi, respectively, including samples from anti-3A10 staining and Tg(hsp:Gal4FF62A; UAS:Eco.NfsB-mCherry) transgenic lines. Among them, 11 of 50 larvae crossed and 39 failed to cross at 24 hpi; 54 of 97 crossed and 43 failed to cross at 48 hpi; and 48 of 51 crossed and 3 failed to cross at 72 hpi. Error bars represent means ± s.d. (D,E) Dynamics of neutrophils from Tg(npsn: mCherry-NTR) and macrophages from Tg(mpeg1.1: GFP-NTR) after injury: (D) representative images and (E) quantification. White dashed lines in (D) outline the analysed region. (F) Representative images of M-cells stained with anti-3A10 antibody at 48 hpi. White dashed lines indicate the injured area. (G) Quantification of the proportion of cebpα siblings and mutants with axons successfully crossing the injury site at 24, 48 and 72 hpi. Statistical data were obtained from three independent experiments. The total number of larvae analysed, including those from anti-3A10 staining and Tg(hsp:Gal4FF62A; UAS:Eco.NfsB-mCherry) transgenic lines (crossed/total), were 31/113 in cebpα siblings and 22/90 in cebpα mutants at 24 hpi, 59/95 in cebpα siblings and 12/45 in cebpα mutants at 48 hpi, 47/55 in cebpα siblings and 33/50 in cebpα mutants at 72 hpi. Data were analysed by two-way ANOVA, ns, p > 0.05, **p < 0.01, ***p < 0.001. Scale bar = 50 µm. Error bars represent means ± s.e.m.
|
