
Fig. 5
- ID
- ZDB-FIG-260528-11
- Publication
- Ghosh et al., 2025 - EIPR1 variants cause a neurodevelopmental disorder with endolysosomal and dense core vesicle defects
- Other Figures
- All Figure Page
- Back to All Figure Page
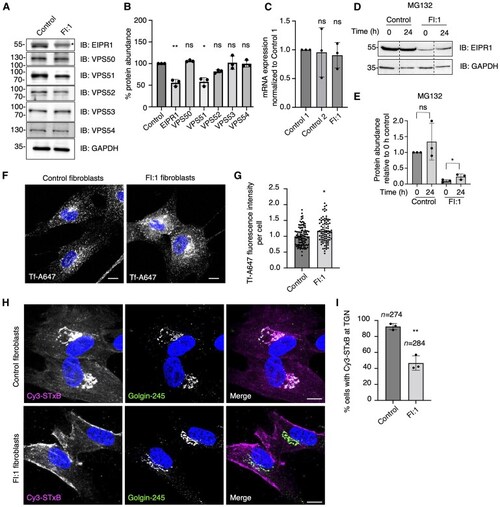
Characterization of EIPR1 levels, transferrin recycling and Shiga toxin retrograde transport in fibroblasts from a patient with the EIPR1 R279G variant. (A) Skin fibroblasts from a homozygous EARP-interacting protein 1 (EIPR1) R279G individual (Patient FI:1) and from her heterozygous father (control) were analysed by sodium dodecyl sulfate-polyacrylamide gel electrophoresis (SDS-PAGE) and immunoblotting (IB) for endogenous EIPR1 and subunits of endosome-associated recycling protein (EARP) and Golgi-associated retrogradeprotein (GARP) complexes. glyceraldehyde-3-phosphate dehydrogenase (GAPDH) was used as a loading control. The positions of molecular mass markers (in kDa) are indicated on the left. (B) Quantification of protein levels normalized to GAPDH protein from three independent experiments such as that shown in A. Protein levels in control fibroblasts were set to 100%. Values are the mean ± standard deviation (SD). Statistical significance was calculated by ANOVA with multiple comparisons using Dunnett’s test. *P < 0.05, **P < 0.01, ns: not significant. (C) Quantification of EIPR1 mRNA expression analysed from an EIPR1 R279G individual (Patient FI:1), control 1 (heterozygous father), and unrelated Control 2 fibroblasts using quantitative reverse transcription polymerase chain reaction (qRT PCR). Values are the mean ± SD. Statistical significance was calculated by ANOVA with multiple comparisons using Dunnett’s test, ns: not significant. (D) Control and EIPR1 R279G (Patient FI:1) fibroblasts were treated with 40 μM MG132 for 24 h. Cells were subsequently analysed by SDS-PAGE and immunoblotting using antibodies to EIPR1 and to GAPDH as a loading control. The positions of molecular mass markers (in kDa) are indicated on the left. (E) Quantification of EIPR1 protein normalized to GAPDH protein from three independent experiments such as that shown in D. Values are the mean ± SD. Statistical significance was calculated using a Student’s t-test. *P < 0.05. ns: not significant. (F) EIPR1 R279G patient and control fibroblasts were cultured on glass coverslips. Cells were next incubated in regular culture medium containing 25 μg/ml Alexa 647-conjugated human transferrin (Tf-A647) for 5 min, washed, chased in regular culture medium for 15 min at 37°C, fixed and mounted with 4',6-diamidino-2-phenylindole (DAPI) to mark the nucleus. Cells were imaged by confocal microscopy. Images are shown in greyscale with DAPI in blue. Scale bars = 10 μm. (G) Quantification of transferrin fluorescence intensity per cell calculated from experiments such as that in C. Values are the mean ± SD. Statistical significance was calculated using a Student’s t-test. *P < 0.05. (H) EIPR1 R279G patient and control fibroblasts were cultured on glass coverslips, incubated in medium containing 0.5 μg/ml Cy3-conjugated Shiga toxin B subunit (Cy3-STxB) for 15 min, washed, chased in regular culture medium for 1 h at 37°C, fixed and immunolabelled with antibody to Golgin-245 to mark the trans-Golgi network (TGN), and stained with DAPI. Cells were examined by confocal fluorescence microscopy. Single-channel images are shown in greyscale with DAPI in blue. Scale bars = 10 μm. (I) Quantification of the percentage of cells having Cy3-STxB at the TGN from immunofluorescence experiments such as that shown in H. Values are the mean ± SD from the number of cells (n) indicated in the figure. Statistical significance was calculated using a Student’s t-test. **P < 0.01. |