
Fig. 4
- ID
- ZDB-FIG-260528-10
- Publication
- Ghosh et al., 2025 - EIPR1 variants cause a neurodevelopmental disorder with endolysosomal and dense core vesicle defects
- Other Figures
- All Figure Page
- Back to All Figure Page
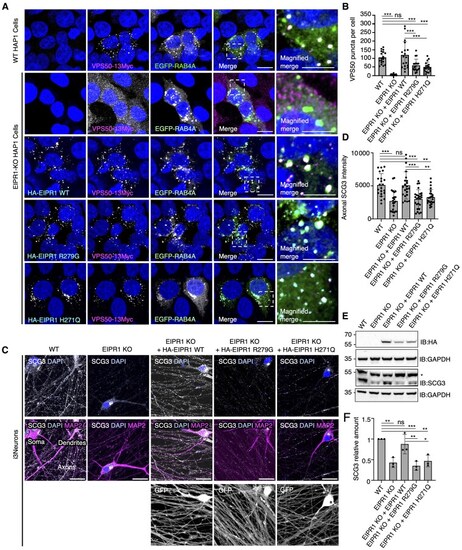
Effect of EIPR1 variants R279G and H271Q on the intracellular localization of VPS50 and dense core vesicles (DCVs). (A) Wild-type (WT) and EIPR1 knockout (KO) HAP1 cells were transiently transfected with plasmids encoding VPS50-13Myc, EGFP-RAB4A and/or WT, R279G or H271Q variants of HA-EIPR1. At 24 h post-transfection, cells were immunolabelled for the haemagglutinin (HA) and myelocytomatosis oncogene (Myc) epitopes, stained with 4',6-diamidino-2-phenylindole (DAPI), and imaged by confocal microscopy. Single channels are shown in greyscale with DAPI in blue. Scale bars = 10 μm. (B) Quantification of the number of VPS50-13Myc positive puncta per cell. Values are the mean ± standard deviation (SD). Statistical significance was calculated by ANOVA with multiple comparisons using Dunnett’s test. ***P < 0.001, ns: not significant. (C) WT or EARP-interacting protein 1 (EIPR1) KO human iPSC-derived i3Neurons cultured for 14 days since differentiation were infected with lentivirus expressing WT, R279G or H271Q variants of HA-EIPR1 plus green fluorescent protein (GFP). After 3 days of infection, neurons were fixed and immunolabelled for endogenous secretogranin III (SCG3) to mark DCVs and MAP2 to mark the soma and dendrites, and stained with DAPI. GFP identifies infected cells. Cells were examined by confocal fluorescence microscopy. Single-channel images are shown in greyscale with DAPI in blue. Scale bars = 20 μm. (D) Quantification of DCV intensity per unit of axonal area. Values are the mean ± SD. Statistical significance was calculated by ANOVA with multiple comparisons using Dunnett’s test. **P < 0.01, ***P < 0.001, ns: not significant. (E) WT, EIPR1 KO and EIPR1 KO neurons expressing WT, R279G or H271Q variants of HA-EIPR1 were analysed by sodium dodecyl sulfate-polyacrylamide gel electrophoresis (SDS-PAGE) and immunoblotting for the HA epitope, endogenous SCG3, and glyceraldehyde-3-phosphate dehydrogenase (GAPDH) as a loading control. The positions of molecular mass markers (in kDa) are indicated on the left. (F) Quantification of SCG3 protein normalized to GAPDH protein from three independent experiments such as that shown in E. Values are the mean ± SD. Statistical significance was calculated by ANOVA with multiple comparisons using Dunnett’s test. **P < 0.01, ***P < 0.001. |