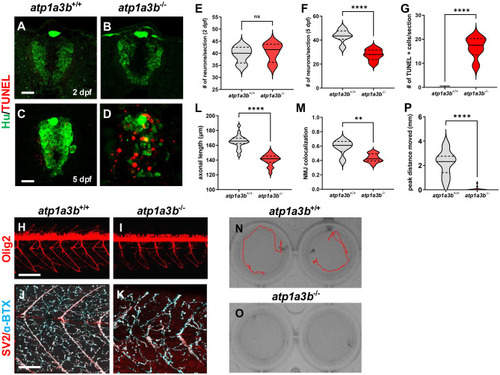
Neuronal hyperexcitability drives neurodegeneration, motor axonopathy, and behavioral deficits. (a-d) Representative transverse section images of the spinal cord from atp1a3b+/+ (a, c) and atp1a3b-/- (b, d) zebrafish. Immunohistochemistry labeling with anti-Hu antibody (green) and terminal deoxynucleotidyl transferase dUTP nick end labeling (TUNEL) staining (red) highlights neuronal populations and apoptotic cells. Scale bar: 10 μm. (e, f) Quantification of Hu+ neurons per section at 2 (e) and (f) 5 days post-fertilization (DPF). Unpaired t-tests were performed for statistical analysis. N = 8 at 2 DPF and n = 12 at 5 DPF. (g) Quantification of TUNEL+ cells per section at 5 DPF between atp1a3b+/+ and atp1a3b-/- zebrafish. Unpaired t-test, n = 8. (h, i) Representative lateral views of the spinal cord from Tg(Olig2:dsRed) atp1a3b+/+ (h) and atp1a3b-/- (i) at 5 DPF. Dsred fluorescence shows motor axons, neuromuscular structure, and motor neurons. Scale bar: 100 μm. (j, k) Representative lateral views of the spinal cord of atp1a3b+/+ (j) and atp1a3b-/- (k) zebrafish at 5 DPF. Immunohistochemistry labeling with anti-SV2 antibody (red) and α-bungarotoxin staining (blue) marking presynaptic and postsynaptic terminals. Scale bar: 50 μm. (l) Quantification of Olig2+ motor axon length at 5 DPF. Unpaired t-test; 32 axons from eight zebrafish per group. (m) Quantification of neuromuscular junction (NMJ) colocalization at 5 DPF. Mann–Whitney test; n = 12. (n, o) The representative images of startle behavior upon tapping stimulus of atp1a3b+/+ (n) and atp1a3b-/- (o). (p) Quantification of the peak distance moved. Mann–Whitney test; n = 19. All data are expressed as medians with interquartile ranges represented in violin plots. Statistical significance denoted as not significant (n.s.), **p < 0.01, ****p < 0.0001
|
