FIGURE

Fig. 3

ID
ZDB-FIG-260515-35
Publication
Lim et al., 2026 - Functional impact of the ATP1A3-p.A813V variant: insights into a calcium-driven hyperexcitability cascade in rapid-onset dystonia-Parkinsonism
Other Figures
All Figure Page
Back to All Figure Page
Fig. 3

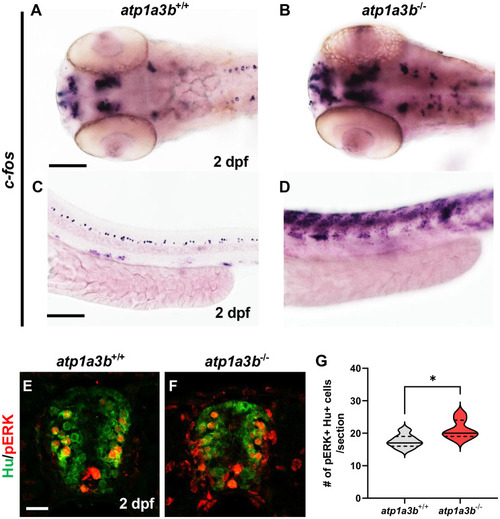
ATP1A3 loss-of-function elicits neuronal hyperexcitability. (a–d) expression of c-fos messenger RNA (a marker of neuronal activity) at 2 days post-fertilization (DPF) in atp1a3b+/+ (a, c) and atp1a3b-/- (b, d) zebrafish. Dorsal views of the brain (a, b) and lateral views of the spinal cord (c, d) are presented. Scale bar: 250 μm (a, b), 500 μm (c, d). (e, f) representative transverse section images of the spinal cord in 2 DPF atp1a3b+/+ (e) and atp1a3b-/- (f) zebrafish. Immunohistochemistry labeling with anti-Hu antibody (green) and anti-pERK (red) highlights neuronal populations and phosphorylated ERK. Scale bar: 10 μm. (g) Quantification of pERK+ Hu+ neurons per section. Unpaired t-test; n = 8

Expression Data
Gene:
Antibodies:
Fish:
Anatomical Terms:
Stage: Long-pec

Expression Detail
Antibody Labeling
Phenotype Data
Fish:
Observed In:
Stage: Long-pec

Phenotype Detail
Acknowledgments
This image is the copyrighted work of the attributed author or publisher, and ZFIN has permission only to display this image to its users. Additional permissions should be obtained from the applicable author or publisher of the image. Full text @ J Transl Med