IMAGE

Fig. 4

ID
ZDB-IMAGE-260515-38
Genes
Antibodies
Publication
Lim et al., 2026 - Functional impact of the ATP1A3-p.A813V variant: insights into a calcium-driven hyperexcitability cascade in rapid-onset dystonia-Parkinsonism
All Figures
Figures for Lim et al., 2026
Image
Figure Caption

Fig. 4

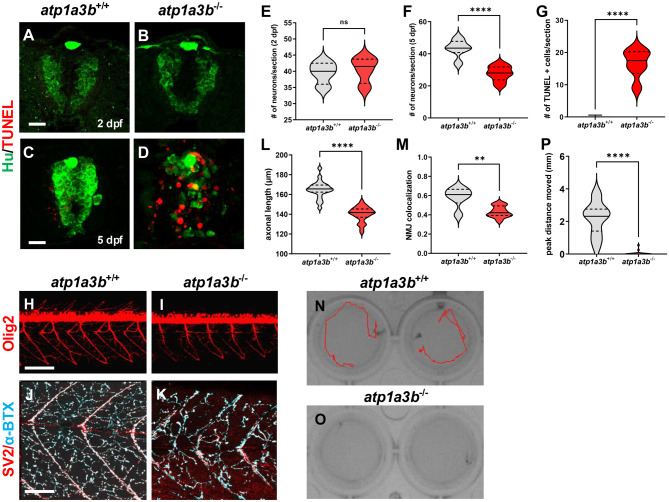
Neuronal hyperexcitability drives neurodegeneration, motor axonopathy, and behavioral deficits. (a-d) Representative transverse section images of the spinal cord from atp1a3b+/+ (a, c) and atp1a3b-/- (b, d) zebrafish. Immunohistochemistry labeling with anti-Hu antibody (green) and terminal deoxynucleotidyl transferase dUTP nick end labeling (TUNEL) staining (red) highlights neuronal populations and apoptotic cells. Scale bar: 10 μm. (e, f) Quantification of Hu+ neurons per section at 2 (e) and (f) 5 days post-fertilization (DPF). Unpaired t-tests were performed for statistical analysis. N = 8 at 2 DPF and n = 12 at 5 DPF. (g) Quantification of TUNEL+ cells per section at 5 DPF between atp1a3b+/+ and atp1a3b-/- zebrafish. Unpaired t-test, n = 8. (h, i) Representative lateral views of the spinal cord from Tg(Olig2:dsRed) atp1a3b+/+ (h) and atp1a3b-/- (i) at 5 DPF. Dsred fluorescence shows motor axons, neuromuscular structure, and motor neurons. Scale bar: 100 μm. (j, k) Representative lateral views of the spinal cord of atp1a3b+/+ (j) and atp1a3b-/- (k) zebrafish at 5 DPF. Immunohistochemistry labeling with anti-SV2 antibody (red) and α-bungarotoxin staining (blue) marking presynaptic and postsynaptic terminals. Scale bar: 50 μm. (l) Quantification of Olig2+ motor axon length at 5 DPF. Unpaired t-test; 32 axons from eight zebrafish per group. (m) Quantification of neuromuscular junction (NMJ) colocalization at 5 DPF. Mann–Whitney test; n = 12. (n, o) The representative images of startle behavior upon tapping stimulus of atp1a3b+/+ (n) and atp1a3b-/- (o). (p) Quantification of the peak distance moved. Mann–Whitney test; n = 19. All data are expressed as medians with interquartile ranges represented in violin plots. Statistical significance denoted as not significant (n.s.), **p < 0.01, ****p < 0.0001

Figure Data
Acknowledgments
This image is the copyrighted work of the attributed author or publisher, and ZFIN has permission only to display this image to its users. Additional permissions should be obtained from the applicable author or publisher of the image. Full text @ J Transl Med