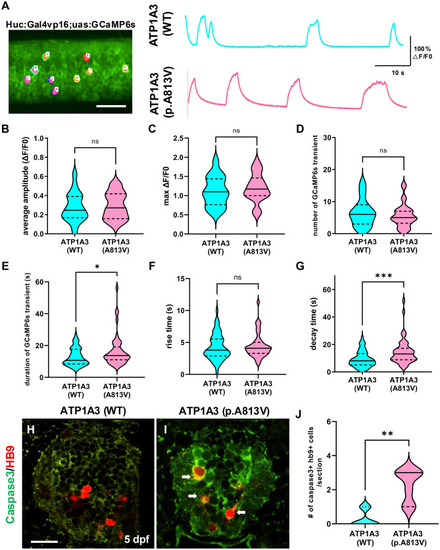
ATP1A3-p.A813V mutation induces prolonged Ca2+ transients, leading to neuronal apoptosis. (a) Representative image of the spinal cord in Tg(Huc:Gal4;uas:GCaMP6s);nacre zebrafish at 3 days post-fertilization (DPF). Regions of interest (ROIs) designated 10 neurons per zebrafish. Scale bar: 50 μm. Individual traces depict GCaMP6s fluorescence signals from spinal neurons overexpressing ATP1A3 (blue) and those overexpressing ATP1A3-p.A813V (pink). (b–g) Quantification of various parameters of GCaMPs transients in neurons. (b) The average amplitude of GCaMPs transients measured in neurons. Mann–Whitney test; n = 18 and n = 16, respectively. (c) Quantification of the maximum amplitude of GCaMPs transients. Unpaired t-test; n = 18 and n = 16, respectively. (d) Quantification of the number of GCaMPs transients. Mann–Whitney test; n = 19, n = 18, and n = 16, respectively. (e) Quantification of duration of GCaMPs transients. Unpaired t-test; n = 18 and n = 16, respectively. (f) Quantification of the rise time of GCaMPs transients. Mann–Whitney test; n = 18 and n = 16, respectively. (g) Quantification of the decay time of GCaMPs transients. Mann–Whitney test; n = 18 and n = 16, respectively. (h, i) representative transverse section images of the spinal cord in zebrafish overexpressing ATP1A3 (WT) (h) and ATP1A3 (p.A813V) (i) at 5 DPF. Immunohistochemistry labeling with anti-active caspase3 antibody (green) in Tg(Hb9:mCherry) zebrafish revealing neuronal cell death. Scale bar: 10 μm. (j) Quantification of Caspase3+ Hb9+ neurons per section at 5 DPF. Mann–Whitney test. analysis conducted on n = 8 zebrafish per group. Statistical significance denoted as not significant (n.s.), *p < 0.05, **p < 0.01, ***p < 0.001
|
