
Figure 7
- ID
- ZDB-FIG-260508-23
- Publication
- Pannese et al., 2026 - Impaired collagen deposition in the absence of ERp44
- Other Figures
- All Figure Page
- Back to All Figure Page
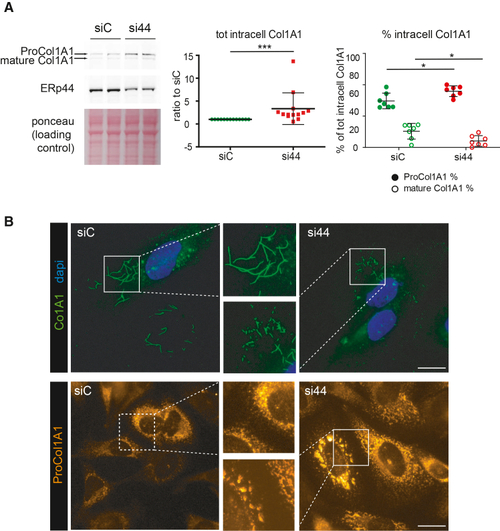
ERp44 KD induces intracellular procollagen 1A1 (ProCol1A1) and mature collagen 1A1 (Col1A1) accumulation in SAOS-2 cells SAOS-2 cells were subjected to silencing of ERp44, or treated with control duplexes (si44 and siC, respectively). After 72 h of silencing, protein extracts were collected. (A) Representative immunoblot images of ProCol1A1, mature Col1A1, and ERp44 proteins with the corresponding Ponceau-stained membrane. Samples were separated on a 4%–12% pre-cast SDS-PAGE gel under reducing conditions in MOPS buffer. Membranes were probed with anti-Col1A1 antibody ( (B) Immunofluorescence images of methanol fixed control (siC) or ERp44 silenced (si44) SAOS-2 cells stained with anti-Col1A1 antibody (top). Under ERp44, downregulation cells show thinner and shorter extracellular fibers deposition (see the boxed area and the higher magnification, middle column). At the bottom, SAOS-2 immunofluorescence images of control (siC) or silenced (si44) cells fixed with PFA, permeabilized and then stained with anti-ProCol1A1 antibody. ProCol1A1 accumulates in the enlarged perinuclear structures (see the boxed area and at higher magnification) in si44 condition. Scale bars, 20 μm. |