
Figure 5
- ID
- ZDB-FIG-260508-21
- Publication
- Pannese et al., 2026 - Impaired collagen deposition in the absence of ERp44
- Other Figures
- All Figure Page
- Back to All Figure Page
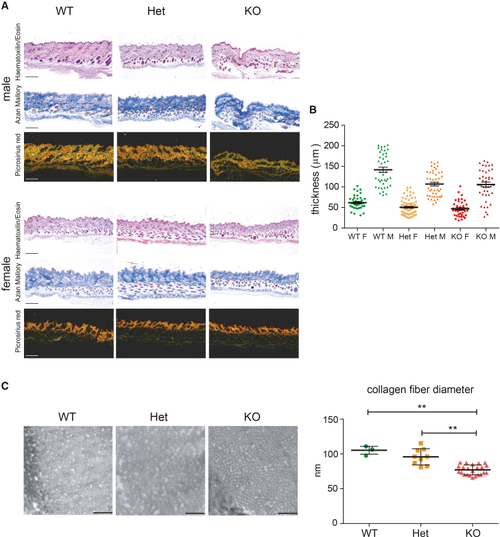
Defective collagen deposition in the skin and tendons of male and female mice reduces dermal collagen layer thickness in ERp44 KO mice (A) Skin section images of WT, Het, and KO mice (males: top; females: bottom) were stained with hematoxylin/eosin, Azan-Mallory trichrome and picrosirius red staining as indicated laterally. Scale bars, 200 μm. (B) Dermal thickness distribution in male and in female mice (3 images/animal and 10 measures for each image). The graph shows the single measurements for male or female ( (C) Example of tail tendon collagen fibers images of WT, Het, and KO male mice by transmission electron microscopy. Scale bars, 500 nm. Collagen fiber diameter quantification is shown in the graph: 1 WT male (4 images), 1 Het male (9 images), 2 KO males (11 and 12 images each) were analyzed. Each dot in the graph corresponds to the average of one single image analyzed. Genotype average ± SD are also shown (WT: 105.3 ± 5.6 nm, Het: 95.8 ± 11.6 nm, KO: 77.0 ± 7.1 nm). One-way ANOVA with Dunnett’s multiple comparison test, ∗∗ |