
Figure 3
- ID
- ZDB-FIG-260501-74
- Publication
- Kakiailatu et al., 2026 - Impact of enteric neuronal loss on intestinal cell composition
- Other Figures
- All Figure Page
- Back to All Figure Page
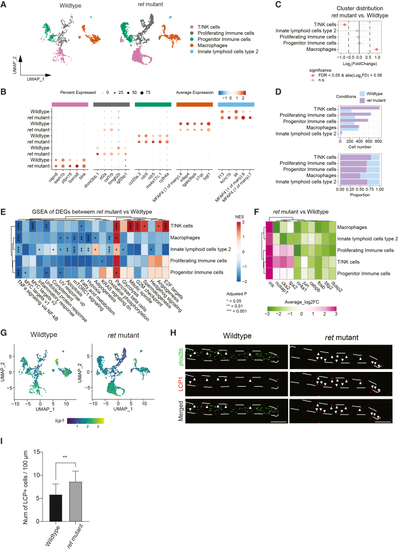
Unique functionality of immune cells in ret mutant zebrafish (A) Uniform manifold approximation and projection (UMAP) analysis of immune cells shows all 5 subclusters. UMAP was separated between wildtype and ret mutant zebrafish. (B) Feature dot plot represents the expression levels of the top 5 expressed (ordered by average log2 fold change) transcripts per subcluster of immune cells between wildtype and ret mutant zebrafish cells. The colored dot on the top indicates the subclusters as shown in (A), and features were separated according to subclusters. (C) Cluster size comparison of each immune cell subcluster between wildtype and ret mutant zebrafish cells. Significantly differentially distributed subclusters are represented in orange. The significance of differences was determined by a threshold of the false discovery rate (FDR) < 0.05 and an absolute log2 fold change >0.58. The dotted line indicated the threshold of log2 fold change. (D) Bar plot (top) and stacked bar plot (bottom) show the cell number contributing to each subcluster of all immune cells in wildtype (light-blue) and ret mutant zebrafish (light-purple) samples. (E) Gene set enrichment analysis (GSEA) of hallmark gene signatures represent different functionality of immune cells subclusters. (F) Heatmap of differentially expressed genes, which were involved in significantly altered hallmark pathways between wildtype and ret mutant immune cells subclusters. Green indicates down-regulated genes in ret mutant immune cells subclusters, while pink indicates up-regulated genes in ret mutant immune cells subclusters. (G) UMAP atlas show the expression pattern of lcp1 in immune cells, separating between wildtype and and ret mutant zebrafish samples. Navy-blue indicates lower expression levels, while yellow indicates higher expression levels. Gray shows non-ret expression cells. (H) IHC staining of Lcp1 in tg(phoxbb:GFP) wildtype and ret mutant zebrafish shows increased numbers of Lcp1+ cells in the ret mutant zebrafish. Representative maximum projections from 5 dpf larvae. The intestine is marked by white dashed lines. Phox2bb+ cells are shown in green and Lcp1+ cells in red. The latter are indicated by white arrowheads. Scale bars represent 80 μm. (I) Graph shows significant increased numbers of Lcp1+ cells in ret mutant zebrafish (n = 12 per group, Student’s t test, p = 0.005). ∗∗: p < 0.01. |
| Gene: | |
|---|---|
| Antibody: | |
| Fish: | |
| Anatomical Term: | |
| Stage: | Day 5 |
| Fish: | |
|---|---|
| Observed In: | |
| Stage: | Day 5 |