
Fig. 7
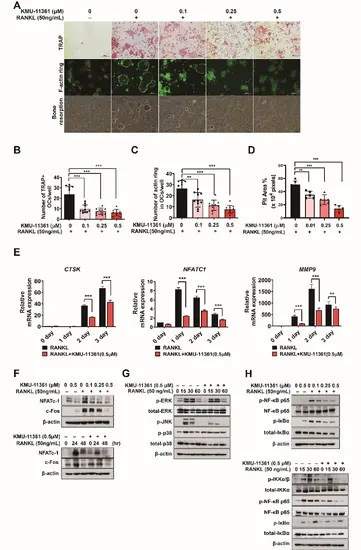
Osteoclastogenesis factors in the respective differentiation of RAW264.7 cell. A–D Cells were pretreated with the indicated concentrations of KMU-11361 for 3 h, and subjected to RANKL (50 ng/mL)-induced differentiation for 5 days. (A) Each microscopic photograph depicts osteoclast differentiation, with TRAP-stained osteoclasts, and staining with rhodamine phalloidin to show bone resorption morphology through F-actin ring formation. B The number of TRAP-positive multinuclear cells was counted. ***p < 0.001 compared with the RANKL only treated group. C Quantification was performed by counting the number of actin rings formed. **p < 0.01, ***p < 0.001 compared with the RANKL only treated group. D The pit area (%) was determined for resorption planes from 5 random fields in each well using the image J program. **p < 0.01***, p < 0.001 compared with RANKL alone treated group. E Total RNA was extracted, and used to evaluate the mRNA expression levels of CTSK, NFATC1, and MMP9 respectively. **p < 0.01, ***p < 0.001 compared with the RANKL only treated group. F Cells were treated with various concentrations of KMU-11,342 (0, 0.01, 0.25, and 0.5 µM) for 1 h and stimulated with the RANKL (50 ng/mL) for 6–24 h and 48 h. Whole cell lysates were isolated and used to measure the protein expression levels of NFAT-c1 and c-Fos by western blot analysis. G, H Cells were pretreated with the indicated concentrations of KMU-11361 for 1 h, and subjected to RANKL-induced differentiation for different time points. A Whole cell lysates were isolated and used to measure the protein expression levels of MAPKs by western blot analysis. H Whole cell lysates were isolated and used to measure the protein expression levels of p-IKKα/β, IKKα, p-NF-κB p65, NF-κB p65, p-IκBα, and IκBα by western blotting Values in the graph indicate the mean ± SD of three independent experiments (n = 3). The protein expression level of β-actin was used as a loading control |