
Fig. 3
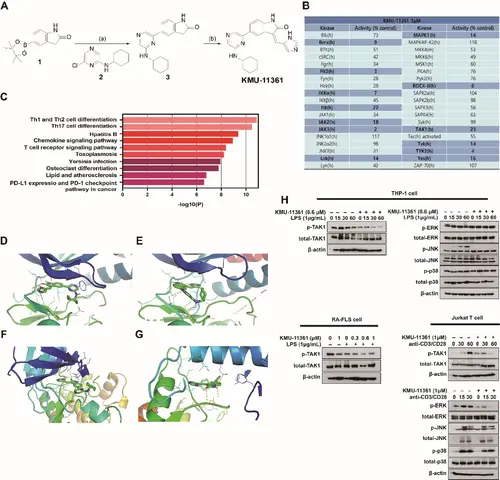
Synthesis of KMU-11361 and its binding properties to the inflammatory kinases TAK1 and MAPK1. A Chemical structure of KMU-11361. B Kinase inhibitory activity and selectivity profile of KMU-11361 against inflammation-related kinases, as determined by kinase assay. C Bar chart of the top enriched terms from the KEGG_2021_Human gene set library. The top 10 enriched terms for the input gene set are displayed based on the −log10 (p value). The term at the top has the most significant overlap with the input query gene set. Colored bars correspond to the terms with significant p values (< 0.05). Two potential binding conformations of KMU-11361 with the MAPK1 and TAK1 proteins are illustrated, based on the binding orientation of the reference compound SU6668. D–G Docking simulation results of KMU-11361 with MAPK1 and TAK1. The D and E panels depict binding poses of KMU-11361 with MAPK1 which share the same binding direction but appear as flipped versions of each other. In conformation, D KMU-11361 interacts with LYS112, MET106, ASP104, and LYS52. In conformation, E the flipped pose engages LYS114, ASP111, MET108, and ASP106. The f and g panels depict the binding poses of KMU-11361 with TAK1 which also share the same binding direction but are flipped relative to each other. In conformation, F KMU-11361 interacts with TYR106 and ASP175, while in conformation [1], G the flipped pose engages GLU77 and ASP175. The protein structures of MAPK1 and TAK1 presented here correspond to the PDB entries 5BUJ, 6G9A, 5JGA, and 4O91, respectively. H macrophage-like THP-1 and human RA-FLS cells were stimulated with LPS (1 µg/mL) for the designated time points and treated with varying concentrations of KMU-11361. Whole cell lysates were isolated and analyzed for TAK1 and MAPK1 protein expression levels using western blot analysis. Jurkat T cells were activated with anti-CD3/CD28 for the designated time points and treated with varying concentrations of KMU-11361. Whole cell lysates were isolated and analyzed for TAK1 and MAPK1 protein expression levels using western blot analysis. The expression level of β-actin protein was used as the loading control |