FIGURE

Figure 2.

ID
ZDB-FIG-260427-56
Publication
Gao et al., 2026 - PCYT1A Hypophosphorylation Underlies Retinal Lipid Dysregulation in CERKL Retinitis Pigmentosa and Is Therapeutically Reversed by Phosphatidylcholine
Other Figures
All Figure Page
Back to All Figure Page
Figure 2.

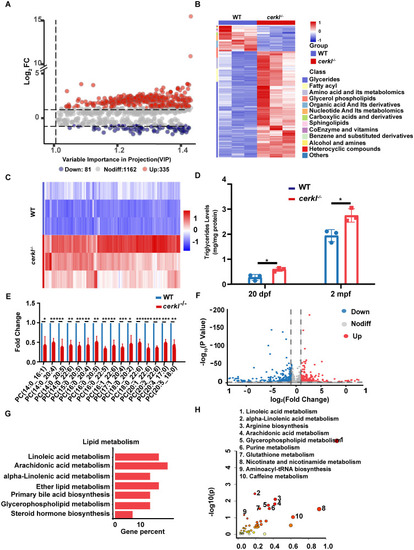
Integrated multi-omics reveals disrupted lipid metabolism in CERKL-deficient retina. (A) Volcano plot of differentially expressed metabolites (DEMs) in cerkl−/− zebrafish compared with WT at 2 mpf. (B) Heatmap showing DEMs in WT and cerkl−/− zebrafish. (C) Heatmap of TG and DAG levels in WT and cerkl−/− zebrafish retina analyzed by metabolic. (D) TG levels in WT and cerkl−/− zebrafish retina at 20 dpf and 2 mpf by TGs analysis kits. *, P < 0.05, ***, P < 0.001. (E) The fold change of PC in cerkl−/− zebrafish retina at 2 months analyzed by metabolic. *, P < 0.05, **, P < 0.01, ***, P < 0.001. (F) Volcano plot of differentially expressed genes in cerkl−/− zebrafish compared with WT at 2 months. (G) KEGG enriched lipid metabolism pathways (P < 0.05) are shown. (H) Representation of pathways altered in cerkl−/− zebrafish based on transcriptomic and metabolomics of lipid data.

Expression Data

Expression Detail
Antibody Labeling
Phenotype Data

Phenotype Detail
Acknowledgments
This image is the copyrighted work of the attributed author or publisher, and ZFIN has permission only to display this image to its users. Additional permissions should be obtained from the applicable author or publisher of the image. Full text @ Invest. Ophthalmol. Vis. Sci.