
FIGURE
Figure 6.
- ID
- ZDB-FIG-260414-73
- Publication
- El-Zoheiry et al., 2026 - Combating Drug Resistance in Mycobacterium Tuberculosis: A Combinatorial in Silico and Experimental Modeling Approach Toward Novel ATP Synthase Inhibitor Discovery
- Other Figures
- All Figure Page
- Back to All Figure Page
Figure 6.
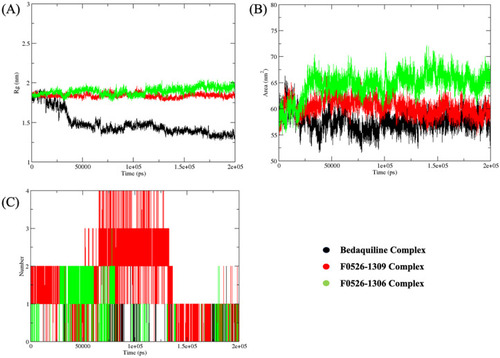
Post-molecular dynamics (MD) analyses of ATP synthase complexes with bedaquiline (black lines), F0526-1309 (red lines), and F0526-1306 (green lines). Radius of gyration (Rg), solvent-accessible surface area (SASA), and the number of intermolecular hydrogen bonds formed in the complexes over a period of 200 ns are shown in panels (A), (B), and (C), respectively. |
Expression Data
Expression Detail
Antibody Labeling
Phenotype Data
Phenotype Detail
Acknowledgments
This image is the copyrighted work of the attributed author or publisher, and
ZFIN has permission only to display this image to its users.
Additional permissions should be obtained from the applicable author or publisher of the image.
Full text @ Bioinform. Biol. Insights