
Image
|
Figure Caption
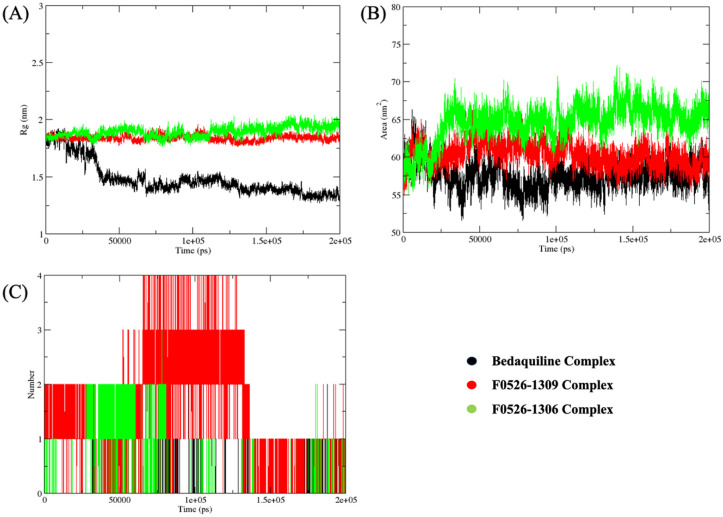
Figure 6.
Post-molecular dynamics (MD) analyses of ATP synthase complexes with bedaquiline (black lines), F0526-1309 (red lines), and F0526-1306 (green lines). Radius of gyration (Rg), solvent-accessible surface area (SASA), and the number of intermolecular hydrogen bonds formed in the complexes over a period of 200 ns are shown in panels (A), (B), and (C), respectively.
Acknowledgments
This image is the copyrighted work of the attributed author or publisher, and
ZFIN has permission only to display this image to its users.
Additional permissions should be obtained from the applicable author or publisher of the image.
Full text @ Bioinform. Biol. Insights