
Fig. 5
- ID
- ZDB-FIG-260409-25
- Publication
- Tasnim et al., 2025 - Functional divergence of Tbx2a and Tbx2b in zebrafish heart development
- Other Figures
- All Figure Page
- Back to All Figure Page
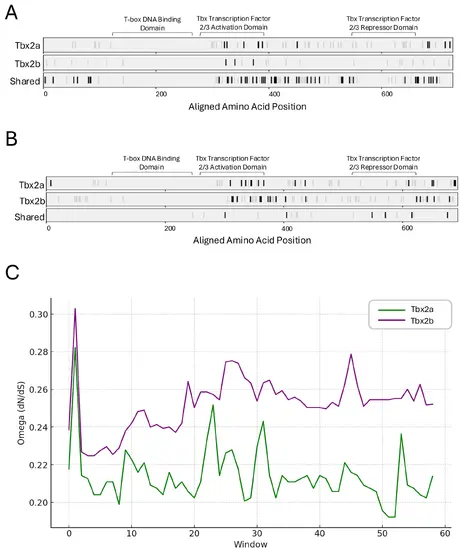
Evolutionary and comparative sequence analysis of Tbx2a and Tbx2b A Comparative alignment of Tbx2a and Tbx2b to the human TBX2 sequence, highlighting evolutionary conservation and divergence across vertebrates. Dark lines represent divergent substitutions with negative PAM250 scores; light grey lines indicate conservative changes. B Distribution of amino acid substitutions in Tbx2a and Tbx2b proteins relative to a reconstructed ancestral Tbx2 sequence. Rows and color coding follow panel A. C Omega (dN/dS) Comparison between Tbx2a and Tbx2b across sliding windows. The chart displays the ratio of non-synonymous to synonymous substitutions (dN/dS) for both Tbx2a (green) and Tbx2b (purple) along 60 windows of the gene sequences |