
FIGURE
Fig. 4
- ID
- ZDB-FIG-260409-24
- Publication
- Tasnim et al., 2025 - Functional divergence of Tbx2a and Tbx2b in zebrafish heart development
- Other Figures
- All Figure Page
- Back to All Figure Page
Fig. 4
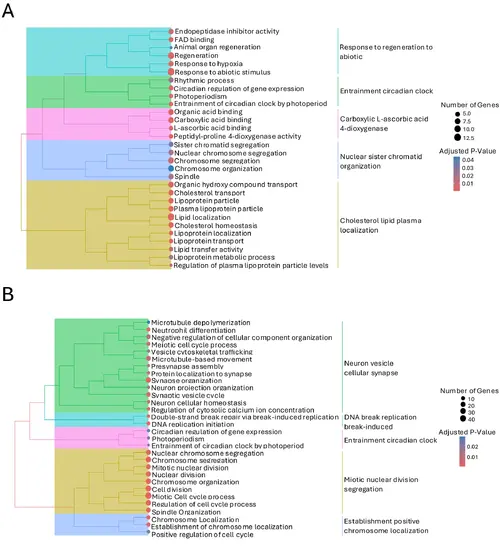
Gene ontology (GO) analysis of tbx2a and tbx2b mutant zebrafish hearts (A–B) Treeplots of gene ontology (GO) analysis for tbx2a (A) and tbx2b (B). Each plot displays the hierarchical clustering of the enriched terms using the Jaccard’s similarity index |
Expression Data
Expression Detail
Antibody Labeling
Phenotype Data
Phenotype Detail
Acknowledgments
This image is the copyrighted work of the attributed author or publisher, and
ZFIN has permission only to display this image to its users.
Additional permissions should be obtained from the applicable author or publisher of the image.
Full text @ EvoDevo