
Fig. 3
- ID
- ZDB-FIG-260409-23
- Publication
- Tasnim et al., 2025 - Functional divergence of Tbx2a and Tbx2b in zebrafish heart development
- Other Figures
- All Figure Page
- Back to All Figure Page
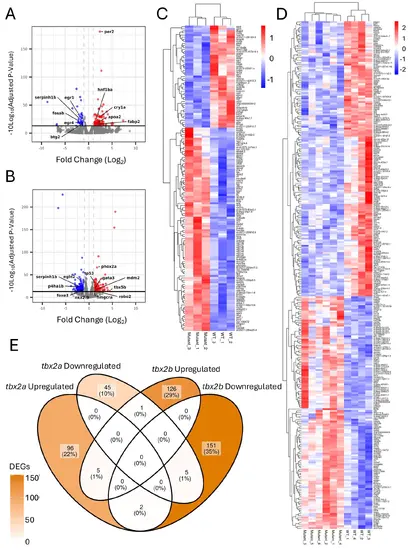
Differential gene expression in tbx2a and tbx2b mutant zebrafish hearts (A–B) Volcano plots illustrating differentially expressed genes (DEGs) in tbx2a (A) and tbx2b (B) mutant hearts compared to wild-type. The x-axis shows the log2 fold change in expression, and the y-axis represents the –log10 of the adjusted p-value. Genes significantly upregulated are shown in red, downregulated genes in blue, and non- significant genes in gray. Vertical dashed gray lines indicate the fold-change thresholds (± 1), and the horizontal line marks the significance cutoff (padj < 0.05). C–D Heatmaps of regularized log2 gene counts of differentially expressed genes in tbx2a (C) and tbx2b (D) mutant hearts compared to wild-type controls. Red indicates higher expression and blue indicates lower expression. Both genes and samples were hierarchically clustered to visualize sample consistency and comparative gene expression patterns. Gene names are shown to the right of each heatmap. E Venn diagram identifying overlapping genes in tbx2a and tbx2b mutants, with darker colors of orange indicating a higher number of differentially expressed genes (DEGs) |