|
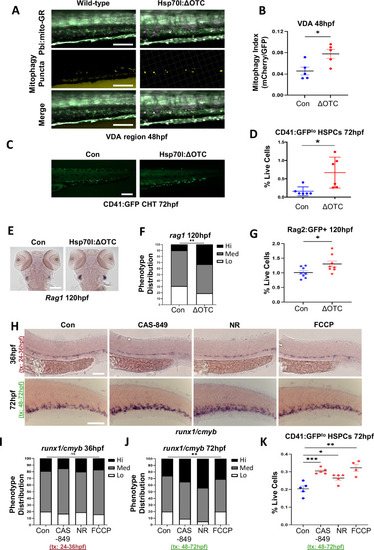
Induction of mitophagy enhances HSPC number and promotes lymphoid development (see also Fig. <xref rid='MOESM1' ref-type='media'>S6</xref>).A Representative image of mitophagy in the CHT at 72 hpf after induction of ΔOTC expression in Tg(hsp70I:ΔOTC;ubi:mito-GR) embryos (heat-shock at 48 hpf: 38 °C for 30 mins). Healthy mitochondria (green/red), mitophagy (yellow); n = 5/condition. Scale bar, 50 µM. B Ratiometric quantification of mitophagy (mCherry/GFP ratio from images of Tg(hsp70I:ΔOTC;ubi:mito-GR) embryos at 48 hpf (*P = 0.0212) [two-tailed unpaired t test with Welch’s correction: mean ± SEM, n = 5 embryos]. C Representative images of CD41lo HSPCs in Tg(hsp70:ΔOTC;−6.0itga2b:EGFP) embryos at 72 hpf following induction of ΔOTC expression at 48 hpf. Scale bar, 200 µM. D Frequency of CD41lo HSPCs in Tg(hsp70:ΔOTC;−6.0itga2b:EGFP) embryos by flow cytometry at 72 hpf after induction of ΔOTC expression at 48 hpf (*P = 0.0307) [two-tailed unpaired t test with Welch’s correction: mean ± SEM, n = 8/condition, 6 clutches]. E Representative WISH images of thymic rag1 at 120 hpf in control and Tg(hsp70:ΔOTC;−6.0itga2b:EGFP) embryos; ΔOTC induced by daily heat-shock from 48 hpf. Scale bar, 100 µM. F Phenotypic distribution of rag1 expression scored in embryos from (E) (**P = 0.00490 [chi-square: n = 18/condition, 4 clutches]. G Frequency of Rag2+ lymphoid progenitor cells in Tg(rag2:GFP) embryos by flow cytometry at 120 hpf after ΔOTC overexpression by daily heat-shock from 48 hpf (*P = 0.0344) [two-tailed unpaired t test with Welch’s correction: Mean ± SEM, n = 15/condition, 4 clutches]. H Representative WISH images of runx1/cmyb expression in embryos treated with CAS-849 (0.25 µM), NR (10 µM), or FCCP (0.01 µM) from 24 to 36 hpf (top row) or 48 to 72 hpf (bottom row) to pharmacologically stimulate mitophagy compared to controls. Scale bar, 100 µM. I Phenotypic distribution of runx1/cmyb expression scored in 36 hpf embryos from (H) (Tx: 24–36 hpf, P = 0.9149) [Pearson’s chi-square (two-sided): n = 20/condition, 3 clutches]. J Phenotypic distribution of runx1/cmyb expression scored in 72 hpf embryos from (H) (Tx: 48–72 hpf, **P = 0.0044) [Pearson’s chi-square (two-sided): n = 20/condition, 3 clutches]. K Frequency of CD41lo HSPCs in Tg(−6.0itga2b:EGFP) embryos by flow cytometry at 72 hpf after treatment (Tx: 48–72 hpf) with CAS-849 (***P = 0.002), NR (*P = 0.0206) or FCCP (**P = 0.0038) vs controls [two-tailed unpaired t test with Welch’s correction: mean ± SEM, n = 8/condition, 5 clutches]. B, D, F, G, I–K Source data are provided as a Source Data file.
|