|
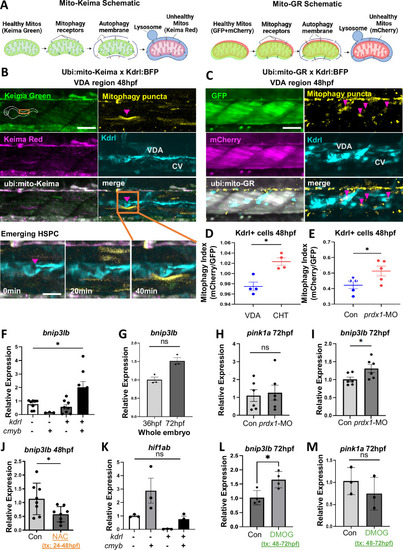
<italic toggle='yes'>Bnip3lb</italic> expression in CHT HSPCs coincides with increased mitophagy (see also Fig. <xref rid='MOESM1' ref-type='media'>S3</xref>).A Schematic depiction of available mitophagy reporter zebrafish models: Mito-Keima (left) and Mito-GR (right), illustrating the pH-dependent shift in detectable color(s). Created in BioRender. Walcheck, M. (2026) https://BioRender.com/2nrnx3j. B Upper: Confocal image of mitophagy in the VDA region of Tg(ubi:mito-Keima) embryos (orange rectangle corresponds to inset) at 48 hpf. Healthy mitochondria (Keima, green), unhealthy mitochondria (Keima, red), mitophagy puncta (highlighted by false-colored yellow), Kdrl+ vasculature (blue); representative image of n = 5 embryos. Scale bar, 50 µM. Lower: Timelapse of an optically zoomed image of distinct mitophagy puncta (pink arrow) forming in a budding HSPC. Scale bar, 20 µM. CV caudal vein. C Confocal image of mitophagy in the VDA region of Tg(ubi:mito-GR) embryos at 48 hpf. Healthy mitochondria (GFP and mCherry), mitophagy (yellow), Kdrl+ vasculature (blue); representative image of n = 10 embryos. Scale bar, 50 µM. D Quantification of mitophagy positive fraction (mCherry/GFP ratio) within Kdrl+ cells in the VDA or CHT of Tg(ubi:mito-GR;kdrl:TagBFP) embryos at 48 hpf by confocal imaging (*P = 0.0051) [two-tailed unpaired t test with Welch’s correction: mean ± SEM, n = 4/condition]. E Quantification of mitophagy positive fraction (mCherry/GFP ratio) of Kdrl+ cells with prdx1 knockdown compared to controls by flow cytometry (P = 0.0453) [two-tailed unpaired t test with Welch’s correction: mean ± SEM, n = 5/condition]. Fbnip3lb qPCR on 48 hpf FACS-isolated Kdrl-cMyb+ myeloid cells, Kdrl+cMyb- ECs, and Kdrl1+cMyb+ HSPCs normalized to the Kdrl-cMyb- fraction (DN vs HSPCs: *P = 0.0223) [two-tailed unpaired t test with Welch’s correction: mean ± SEM, n = 200/clutch, 8 clutches]. G qPCR for bnip3lb expression in 36 hpf versus 72 hpf embryos (*P = 0.0113) [two-tailed unpaired t test with Welch’s correction: mean ± SEM, n = 20/condition, 3 clutches]. H qPCR for pink1a in control and prdx1-morphant tail fractions at 72 hpf (P = 0.7617) [two-tailed unpaired t test with Welch’s correction: mean ± SEM, n = 15/condition, 6 clutches]. I qPCR for bnip3lb in control and prdx1-morphant tail fractions at 72 hpf (*P = 0.0471) [two-tailed unpaired t test with Welch’s correction: mean ± SEM, n = 15/condition, 6 clutches]. Jbnip3lb qPCR on 48 hpf embryo tail fractions after treatment with 10 µM NAC from 24 to 48 hpf (*P = 0.033) [two-tailed unpaired t test with Welch’s correction: mean ± SEM, n = 5/condition, 5 clutches]. Khif1ab qPCR on 48 hpf FACS-isolated Kdrl/cMyb fractions, as described in (F) (DN vs HSPCs: P = 0.4027) [two-tailed unpaired t test with Welch’s correction: mean ± SEM, n = 200/clutch, 3 clutches]. Lbnip3lb qPCR on 72 hpf tail fractions of control and Hif1α activator DMOG (10 µM, 36–48 hpf) treated embryos (*P = 0.0160) [two-tailed unpaired t test with Welch’s correction: mean ± SEM, n = 12/condition, 4 clutches]. Mpink1a qPCR on 72 hpf control and DMOG-treated tail fractions as in (L) (P = 0.3623) [two-tailed unpaired t test with Welch’s correction: mean± EM, n = 15/condition, 3 clutches]. D–M Source data are provided as a Source Data file.
|