|
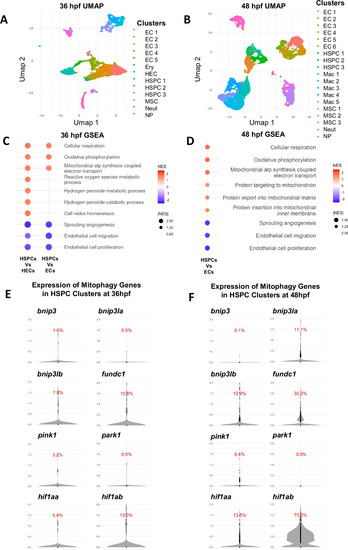
scRNAseq analysis reveals mitophagy gene expression in nascent HSPCs (see also Fig. <xref rid='MOESM1' ref-type='media'>S2</xref>).A UMAP-clustering of all sequenced Kdrl:mCherry+ cells sorted from dissociated tails of 36 hpf Tg(kdrl:Has.HRAS-mCherry)s916 embryos; distinct clusters are defined by color and identified by established marker gene expression. EC endothelial cell, Ery erythrocyte, HEC hemogenic endothelial cell, HSPC hematopoietic stem and progenitor cell, MSC mesenchymal cell, Neut. neutrophil and NP Neuro-progenitor. B UMAP-clustering of all sequenced Kdrl:mCherry+ cells sorted from dissociated tails of 48 hpf Tg(kdrl:Has.HRAS-mCherry)s916 embryos. Distinct clusters defined as in (A). C Dot plot depicting GSEA for differentially expressed genes from HSPCs vs Hemogenic Endothelial Cells (HECs) or Endothelial Cells (ECs) at 36 hpf. Color of each dot indicates relative increase (red) or decrease (blue) in gene expression, with stronger intensity representing a more significant change; dot size represents relative correlation to Normalized Enrichment Score (NES). D Dot plot depicting GSEA of differentially expressed genes from HSPCs vs Endothelial Cells (ECs) at 48 hpf depicted as in (C). E Expression of mitophagy-related genes of interest in the HSPC clusters at 36 hpf. F Expression of mitophagy-related genes of interest in the HSPC clusters at 48 hpf.
|