
Fig. 5
- ID
- ZDB-FIG-260402-17
- Publication
- Torres-Martínez et al., 2026 - Triploidy alters hormonal and paracrine signaling to promote male development in zebrafish
- Other Figures
- All Figure Page
- Back to All Figure Page
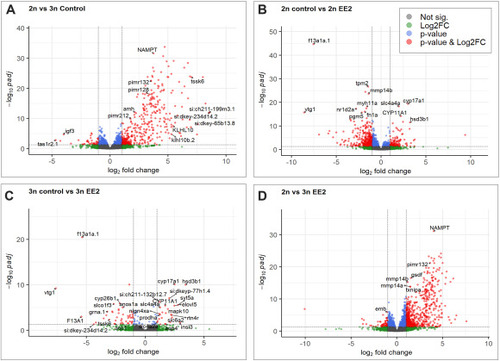
Volcano plots of differentially expressed genes (DEGs) indicating some of the most upregulated and downregulated genes in (A) triploid control (3n) compared to diploid control (2n) zebrafish gonads, (B) EE2-treated diploid (2n + EE2) compared to diploid controls (2n) and, (C) EE2-treated triploid (3n + EE2) gonads compared to triploid controls (3n). (D). The volcano plots depict the DEGs between the gonads of EE-treated triploid vs diploid zebrafish gonads, showing uniquely regulated genes. In all cases, the X axis of each graph shows the log2 fold change while the Y axis show the-log10 adjusted p-value for DEGs between experimental groups. DEGS meeting both criteria, FDR-adjusted p < 0.05 and |log2FC| ≥ 1, are highlighted in red. Genes meeting only the log2 fold change or p-value thresholds are shown in green and blue, respectively. Genes with no significant changes are shown in grey. (For interpretation of the references to color in this figure legend, the reader is referred to the Web version of this article.) |
Reprinted from Molecular and Cellular Endocrinology, , Torres-Martínez, A., Tichopád, T., Pšenička, M., Franěk, R., Triploidy alters hormonal and paracrine signaling to promote male development in zebrafish, 112740112740, Copyright (2026) with permission from Elsevier. Full text @ Mol. Cell. Endocrinol.