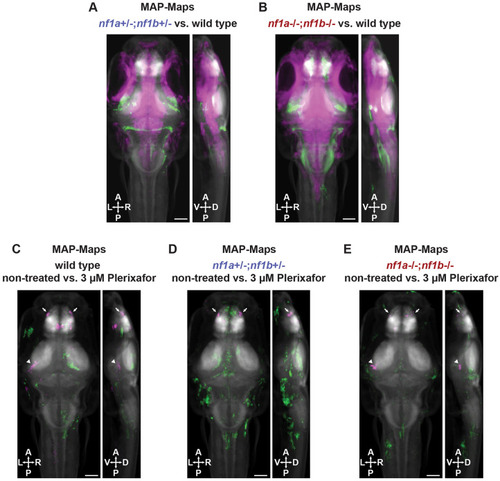
MAP-mapping of pERK shows that Cxcr4 inhibition has limited effect on canonical Ras signaling in the brain. (A,B) MAP-maps showing statistically significant median z-score differences in non-treated (A) nf1a+/−;nf1b+/− versus wild-type larvae and (B) nf1a−/−;nf1b−/− versus wild-type larvae. Green signals represent increased pERK levels in nf1 mutant larvae compared to wild type. Magenta signals denote decreased levels of phosphorylated ERK1/2 (pERK) in nf1 mutant larvae compared to those in wild type. (C,E) Genotype-matched plerixafor treatment. MAP-maps showing statistically significant median z-score differences in non-treated versus 3 µM plerixafor-treated wild-type (C), nf1a+/−;nf1b+/− (D) and nf1a−/−;nf1b−/− (E) larvae. Green signals represent increased pERK levels in plerixafor-treated compared to non-treated larvae within each genotype. Magenta signals represent decreased pERK levels in plerixafor-treated compared to non-treated larvae within each genotype. Arrowheads indicate the torus semicircularis region of interest (ROI) within the midbrain. Arrows indicate the olfactory bulb ROI. All larvae were fixed and stained at 6 dpf. The z-scores were calculated using Mann–Whitney U statistics with the significance threshold set by using a false discovery rate (FDR) of 0.00005. n=18-20 larvae per treatment group. A, anterior; D, dorsal; P, posterior; V, ventral. Scale bars: 200 µM.
|
