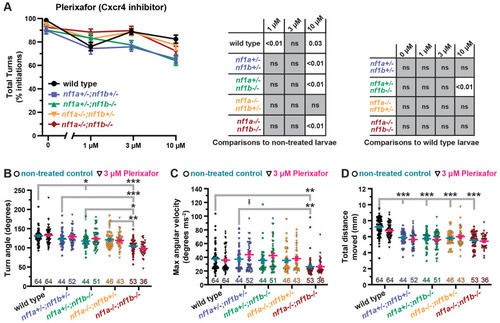
Inhibition of Cxcr4 does not affect general motor performance at doses that improve habituation. (A) Percent initiation of total reactions±s.e.m. in 5 dpf wild-type and nf1 mutant larvae treated with plerixafor. Data points represent average initiation percentage from all larvae tested within each genotype at each treatment dose (sample sizes: WT control n=63, 1 µM n=64, 3 µM n=63, 10 µM n=62; nf1a+/−;nf1b+/− control n=44, 1 µM n=45, 3 µM n=53, 10 µM n=39; nf1a+/−;nf1b−/− control n=44, 1 µM n=39, 3 µM n=50, 10 µM n=52; nf1a−/−;nf1b+/− control n=45, 1 µM n=44, 3 µM n=42, 10 µM n=42; nf1a−/−;nf1b−/− control n=53, 1 µM n=51, 3 µM n=37, 10 µM n=50). Two-way ANOVA showed statistically significant differences between treatment groups [F(3,414)=11.27, P<0.001], as well as a statistically significant interaction between genotype and treatment factors [F(12,962)=1.907, P=0.030]. Dunnet's adjusted P-values were used for comparisons between non-treated larvae within each genotype. (B-D) Turn angle, maximum angular velocity and total distance moved in response to baseline high-intensity stimuli±s.e.m. in 5 dpf wild-type and nf1 mutant larvae treated with 3 µM plerixafor. Data points represent average values from individual larvae in response to ten high-intensity stimuli. Sample sizes are indicated with color-coded numbers along the x-axis. Tukey's adjusted P-values were used for comparing genotypes. (B) Two-way ANOVA showed statistically significant differences in turn angle between genotypes [F(4,487)=27.80, P<0.001] but not plerixafor treatment [F(1,487)=0.4121, P=0.521]. (C) Two-way ANOVA showed statistically significant differences in maximum angular velocity between genotypes [F(4,487)=8.309, P<0.001] but not plerixafor treatment [F(1,487)=3.100, P=0.079]. (D) Two-way ANOVA showed statistically significant differences in total distance moved between genotypes [F(4,487)=42.29, P<0.001] but not plerixafor treatment [F(1,487)=2.735, P=0.099]. *P<0.05, **P<0.01, ***P<0.001.
|
