IMAGE

Fig. 3.

ID
ZDB-IMAGE-260401-91
Antibodies
Publication
Miller et al., 2026 - Inhibition of Cxcr4 chemokine receptor signaling improves habituation learning in a zebrafish model of Neurofibromatosis
All Figures
Figures for Miller et al., 2026
Image
Figure Caption

Fig. 3.

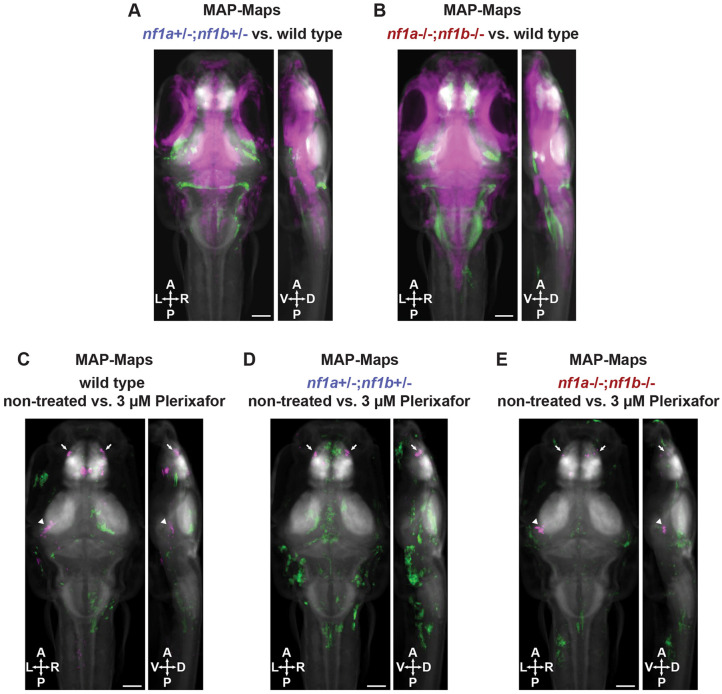
MAP-mapping of pERK shows that Cxcr4 inhibition has limited effect on canonical Ras signaling in the brain. (A,B) MAP-maps showing statistically significant median z-score differences in non-treated (A) nf1a+/−;nf1b+/− versus wild-type larvae and (B) nf1a−/−;nf1b−/− versus wild-type larvae. Green signals represent increased pERK levels in nf1 mutant larvae compared to wild type. Magenta signals denote decreased levels of phosphorylated ERK1/2 (pERK) in nf1 mutant larvae compared to those in wild type. (C,E) Genotype-matched plerixafor treatment. MAP-maps showing statistically significant median z-score differences in non-treated versus 3 µM plerixafor-treated wild-type (C), nf1a+/−;nf1b+/− (D) and nf1a−/−;nf1b−/− (E) larvae. Green signals represent increased pERK levels in plerixafor-treated compared to non-treated larvae within each genotype. Magenta signals represent decreased pERK levels in plerixafor-treated compared to non-treated larvae within each genotype. Arrowheads indicate the torus semicircularis region of interest (ROI) within the midbrain. Arrows indicate the olfactory bulb ROI. All larvae were fixed and stained at 6 dpf. The z-scores were calculated using Mann–Whitney U statistics with the significance threshold set by using a false discovery rate (FDR) of 0.00005. n=18-20 larvae per treatment group. A, anterior; D, dorsal; P, posterior; V, ventral. Scale bars: 200 µM.

Figure Data
Acknowledgments
This image is the copyrighted work of the attributed author or publisher, and ZFIN has permission only to display this image to its users. Additional permissions should be obtained from the applicable author or publisher of the image. Full text @ Dis. Model. Mech.