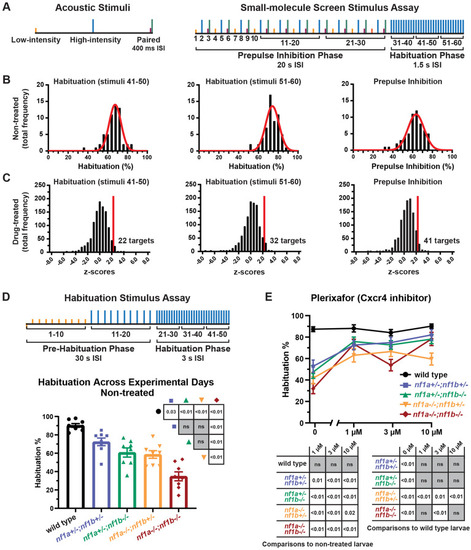
Small-molecule screen reveals Cxcr4 signaling regulates habituation in nf1 mutant larvae. (A) Depiction of the stimulus assay used in combination with small-molecule screen. The low-intensity stimulus was designed to elicit 25% SLC responses. The high-intensity stimulus was designed to elicit 75% SLC responses. Paired low and high intensity stimuli were used during the prepulse inhibition (PPI) phase. The interstimulus interval (ISI) was reduced from 20 s to 1.5 s during the habituation phase. (B) Histograms demonstrating the frequency distribution of habituation and PPI percentage averaged across experimental days in 5 dpf non-treated nf1 mutants. Each average was recorded from groups of 32 nf1 mutant larvae. A nonlinear regression was fitted to each distribution. The distribution average and standard deviation was used to calculate z-scores to determine compounds that significantly affect behavioral measures. (C) Histograms demonstrating the frequency distribution of z-scores calculated for effects of individual compounds. Each average was recorded from groups of 32 treated nf1 mutant larvae. A z-score threshold (2.326) was set representing the one-sided 99% confidence interval to identify compounds that improved habituation or PPI. (D) (Top) Depiction of the modified stimulus assay used to measure habituation. (Bottom) Habituation±s.e.m. in 5 dpf wild-type and nf1 mutant larvae. Data points represent the average habituation from all larvae tested within each genotype on each experimental day (n=8). In total, 148-213 larvae were tested per genotype. One-way ANOVA showed a statistically significant difference between genotypes [F(4,35)=23.62, P<0.001]. Tukey's adjusted P-values were used for comparisons between genotypes. (E) Habituation±s.e.m. for 5 dpf wild-type and nf1 mutant larvae treated with plerixafor. Data points represent average habituation from all larvae tested within each genotype at each treatment dose (sample sizes: WT control n=61, 1 µM n=43, 3 µM n=53, 10 µM n=40; nf1a+/−;nf1b+/− control n=38, 1 µM n=31, 3 µM n=42, 10 µM n=19; nf1a+/−;nf1b−/− control n=38, 1 µM n=34, 3 µM n=38, 10 µM n=17; nf1a−/−;nf1b+/− control n=41, 1 µM n=34, 3 µM n=37, 10 µM n=31; nf1a−/−;nf1b−/− control n=50, 1 µM n=42, 3 µM n=34, 10 µM n=29). Two-way ANOVA showed statistically significant differences between treatment groups [F(3,732)=31.11, P<0.001], as well as an interaction between the genotype and treatment factors [F(12,732)=4.017, P<0.001]. Dunnet's adjusted P-values (below graphs) were used for comparing non-treated larvae within each genotype and comparisons to wild-type larvae within each treatment dose.
|
