IMAGE

Fig. 1.

ID
ZDB-IMAGE-260401-89
Publication
Miller et al., 2026 - Inhibition of Cxcr4 chemokine receptor signaling improves habituation learning in a zebrafish model of Neurofibromatosis
All Figures
Figures for Miller et al., 2026
Image
Figure Caption

Fig. 1.

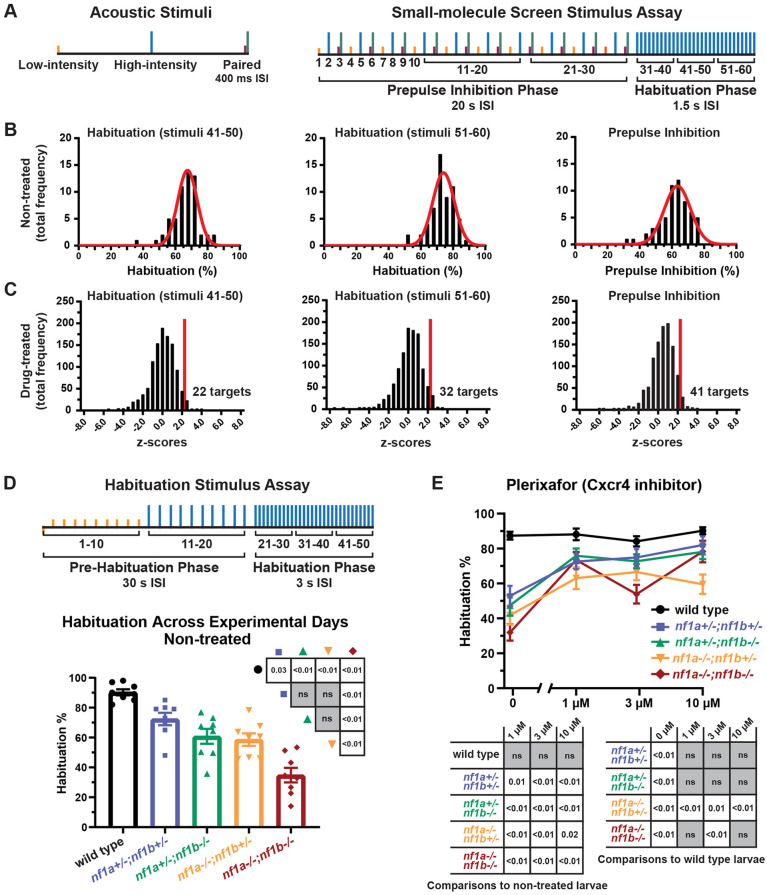
Small-molecule screen reveals Cxcr4 signaling regulates habituation in nf1 mutant larvae. (A) Depiction of the stimulus assay used in combination with small-molecule screen. The low-intensity stimulus was designed to elicit 25% SLC responses. The high-intensity stimulus was designed to elicit 75% SLC responses. Paired low and high intensity stimuli were used during the prepulse inhibition (PPI) phase. The interstimulus interval (ISI) was reduced from 20 s to 1.5 s during the habituation phase. (B) Histograms demonstrating the frequency distribution of habituation and PPI percentage averaged across experimental days in 5 dpf non-treated nf1 mutants. Each average was recorded from groups of 32 nf1 mutant larvae. A nonlinear regression was fitted to each distribution. The distribution average and standard deviation was used to calculate z-scores to determine compounds that significantly affect behavioral measures. (C) Histograms demonstrating the frequency distribution of z-scores calculated for effects of individual compounds. Each average was recorded from groups of 32 treated nf1 mutant larvae. A z-score threshold (2.326) was set representing the one-sided 99% confidence interval to identify compounds that improved habituation or PPI. (D) (Top) Depiction of the modified stimulus assay used to measure habituation. (Bottom) Habituation±s.e.m. in 5 dpf wild-type and nf1 mutant larvae. Data points represent the average habituation from all larvae tested within each genotype on each experimental day (n=8). In total, 148-213 larvae were tested per genotype. One-way ANOVA showed a statistically significant difference between genotypes [F(4,35)=23.62, P<0.001]. Tukey's adjusted P-values were used for comparisons between genotypes. (E) Habituation±s.e.m. for 5 dpf wild-type and nf1 mutant larvae treated with plerixafor. Data points represent average habituation from all larvae tested within each genotype at each treatment dose (sample sizes: WT control n=61, 1 µM n=43, 3 µM n=53, 10 µM n=40; nf1a+/−;nf1b+/− control n=38, 1 µM n=31, 3 µM n=42, 10 µM n=19; nf1a+/−;nf1b−/− control n=38, 1 µM n=34, 3 µM n=38, 10 µM n=17; nf1a−/−;nf1b+/− control n=41, 1 µM n=34, 3 µM n=37, 10 µM n=31; nf1a−/−;nf1b−/− control n=50, 1 µM n=42, 3 µM n=34, 10 µM n=29). Two-way ANOVA showed statistically significant differences between treatment groups [F(3,732)=31.11, P<0.001], as well as an interaction between the genotype and treatment factors [F(12,732)=4.017, P<0.001]. Dunnet's adjusted P-values (below graphs) were used for comparing non-treated larvae within each genotype and comparisons to wild-type larvae within each treatment dose.

Figure Data
Acknowledgments
This image is the copyrighted work of the attributed author or publisher, and ZFIN has permission only to display this image to its users. Additional permissions should be obtained from the applicable author or publisher of the image. Full text @ Dis. Model. Mech.