|
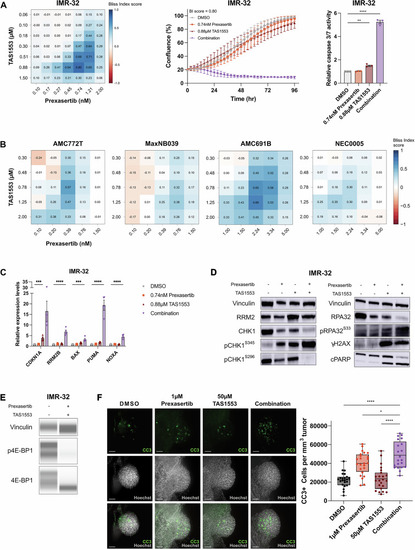
Benchmarking TAS1553-prexasertib drug synergism in vitro and in vivo.A Heatmap showing the Bliss Index (BI) scores for IMR-32 after 96 h of treatment with a range of concentrations of TAS1553 and prexasertib. N = 4 biological replicates in duplicate (left). Cell confluency was monitored for 96 h and cells were treated with the concentrations with the highest BI score (0.74 nM prexasertib and 0.88 µM TAS1553). N = 4 biological replicates in duplicate, error bars represent SEM (middle). Caspase-Glo luminescence-based measurements of caspase 3/7 activity in IMR-32 following treatment with TAS1553 and prexasertib for 48 h. N = 3 biological replicates in triplicate, error bars represent SEM. Statistical significance was measured using one-way ANOVA followed by a Dunnett’s multiple comparison test (**= p ≤ 0.01, ****= p ≤ 0.0001) (right). B Heatmaps showing the BI scores for established NB tumoroids MaxNB039, AMC691B and AMC772T, and PDX-derived NB tumoroid NEC0005 after 120 h of treatment with a range of TAS1553 in combination with prexasertib. N = 3 biological replicates performed in triplicate. C RT-qPCR based measurements of mRNA expression of apoptotic genes BAX, PUMA and NOXA, and the p21 target genes CDKN1A and RRM2B after treatment of IMR-32 with the combination of TAS1553 (0.88 µM) and prexasertib (0.74 nM) that resulted in the highest synergy scores at 48 h. N = 4 biological replicates in duplicate. Statistical significance was measured using the one-way ANOVA followed by a Dunnett’s multiple comparison test (***= p ≤ 0.001, ****= p ≤ 0.0001), error bars represent SEM. D Representative immunoblotting data for various replicative stress and DNA damage markers in IMR-32 following 48 h treatment with 0.74 nM prexasertib and 0.88 µM TAS1553. The quantification of all replicates (N = 3) is shown in Supplementary Figure S8A. E Representative immunoblotting data for p4E-BP1 and 4E-BP1 in IMR-32 following 48 h treatment with 0.74 nM prexasertib and 0.88 µM TAS1553. The quantification of all replicates (N = 3) is shown in Supplementary Figure S8B. F Representative image of zebrafish treated with DMSO (N = 23), 1 µM prexasertib (N = 24), 50 µM TAS1553 (N = 23) or 1 µM prexasertib and 50 µM TAS1553 (N = 21). Cleaved caspase 3 (CC3) is shown in green and Hoechst in grey, scale bar represents 50 µm (left). Boxplot showing increased CC3 levels in SK-N-AS NB cells injected in zebrafish after 96 h of treatment with 1 µM prexasertib and 50 µM TAS1553 (right). Statistical significance was measured using the one-way ANOVA followed by a Dunnett’s multiple comparison test (*= p ≤ 0.05, ****= p ≤ 0.0001), error bars represent min and max and average is shown.
|