|
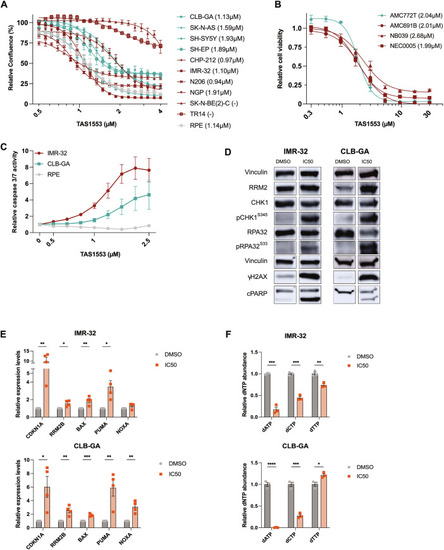
TAS1553 reduces neuroblastoma cell growth and induces RS stress, DNA damage and apoptosis in vitro.A Dose-response curves following 96 h of TAS1553 exposure in a panel of NB cell lines, including 6 MYCN amplified (red) and 4 MYCN non-amplified (blue), and the nonmalignant RPE cell line (grey) using the IncuCyte® Live-Cell imaging. The IC50 of each cell line is indicated between the brackets. Graphs represent the mean of 3-5 biological replicates in triplicate ± standard error of the mean (SEM). B Dose-response curves following 120 h of TAS1553 exposure in a panel of NB tumoroids and their respective IC50, including MYCN amplified (red) and MYCN non-amplified (blue). Cell viability was measured using the CellTiter-Glo® 3D Cell Viability Assay. N = 3 biological replicates in triplicate ± SEM. C Caspase-Glo luminescence-based measurements of caspase 3/7 activity in IMR-32, CLB-GA and RPE following TAS1553 treatment for 48 h. Graphs represent the mean of 3 biological replicates in triplicate ± SEM. D Representative immunoblotting data for various replicative stress and DNA damage markers in IMR-32 and CLB-GA following 48 h treatment with their respective IC50 of TAS1553 (1.18 µM and 1.54 µM respectively). The quantification of all individual biological replicates is shown in Supplementary Figure S1D. E RT-qPCR based measurements of mRNA expression levels of the apoptotic genes BAX, PUMA and NOXA, and the p53 target genes CDKN1A and RRM2B after treatment of IMR-32 (top) and CLB-GA (bottom) cell lines with their respective IC50 of TAS1553 at 48 h. Graphs represent the mean of 4 biological replicates ± SEM. Statistical significance was measured using the multiple unpaired T-test (*= p ≤ 0.05, **= p ≤ 0.01, ***=p ≤ 0.001). F dNTP pools are reduced in IMR-32 and CLB-GA upon treatment with the IC50 of TAS1553 for 48 h. Statistical significance was measured using the unpaired T-test (*= p ≤ 0.05, **=p ≤ 0.01, ***= p ≤ 0.001, ****=p ≤ 0.0001), error bars represent SEM.
|