
FIGURE
Figure 7
- ID
- ZDB-FIG-260311-600
- Publication
- Zheng et al., 2026 - Neurotoxic Effects of Acute Tributyltin Exposure in Adult Zebrafish: Behavioral Impairments and Mechanistic Insights
- Other Figures
- All Figure Page
- Back to All Figure Page
Figure 7
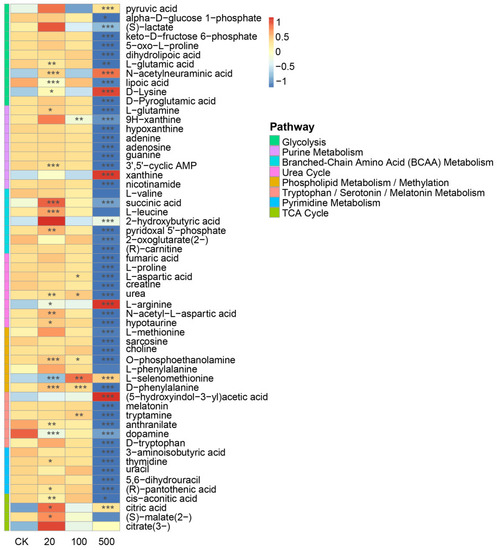
Heatmap showing differential metabolite abundances across various metabolic pathways in response to TBT treatment. The color scale represents metabolite levels (red: increased, blue: decreased) at different TBT concentrations (CK, 20, 100, and 500). Asterisks indicate statistical significance levels (* |
Expression Data
Expression Detail
Antibody Labeling
Phenotype Data
Phenotype Detail
Acknowledgments
This image is the copyrighted work of the attributed author or publisher, and
ZFIN has permission only to display this image to its users.
Additional permissions should be obtained from the applicable author or publisher of the image.
Full text @ Metabolites