
FIGURE
Figure 6
- ID
- ZDB-FIG-260311-599
- Publication
- Zheng et al., 2026 - Neurotoxic Effects of Acute Tributyltin Exposure in Adult Zebrafish: Behavioral Impairments and Mechanistic Insights
- Other Figures
- All Figure Page
- Back to All Figure Page
Figure 6
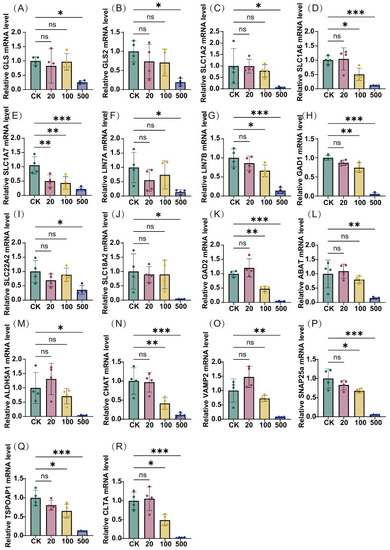
Transcription levels of neurotransmitter pathway-related genes following TBT exposure. The expression levels of 18 pivotal genes were assessed across varying concentrations of TBT (20, 100, and 500 ng/L) and compared to the control group (CK). The genes included are ( |
Expression Data
Expression Detail
Antibody Labeling
Phenotype Data
Phenotype Detail
Acknowledgments
This image is the copyrighted work of the attributed author or publisher, and
ZFIN has permission only to display this image to its users.
Additional permissions should be obtained from the applicable author or publisher of the image.
Full text @ Metabolites