|
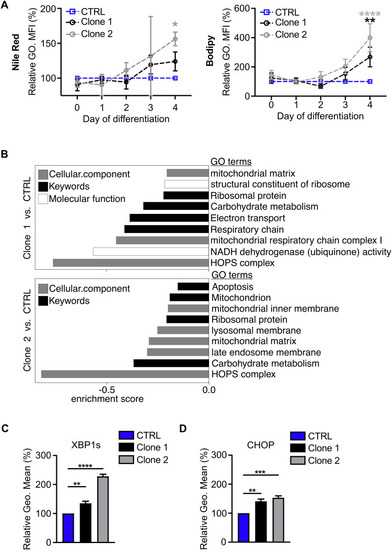
Vps18+/- mutant Hoxb8 neutrophil progenitors display signs of impaired metabolism and cell stress. A Quantification of lipid-droplet staining with Nile red (left panel) and Bodipy (right panel) of indicated genotypes during differentiation (day 0-4) analyzed by flow cytometry (normalized to CTRL cells, 100%). Mean ± SEM. n = 3 (Nile red), n ≥ 7 (Bodipy). *P < 0.05, **P < 0.01, ***P < 0.0001 compared to CTRL (d4), two-way ANOVA, Tukey’s multiple comparisons test. B Strongly reduced gene ontology (GO) terms in clone 1 and 2 compared to CTRL cells at day 2 of differentiation by 1D enrichment analysis of MS data. C, D Quantification of cell stress markers XBP1s (C) and CHOP (D) at day 3 of differentiation by flow cytometry (normalized to CTRL cells, 100%). n = 4. **P < 0.01, ***P < 0.0001, ****P < 0.0001 compared to CTRL. Mean ± SEM, one-way ANOVA, Tukey’s multiple comparisons test.
|