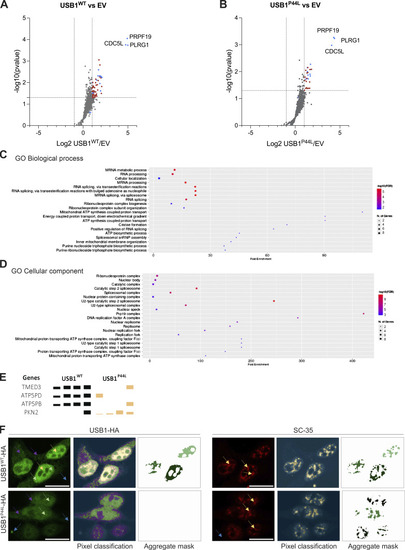
USB1WTand USB1P44Linteractome compared to the empty vector (EV), gene ontology (GO) enrichment analysis, and immunofluorescence pixel quantification. (A and B) Volcano plot of USB1WT (A) and USB1P44L (B) interactome compared to the EV (n = 4). Red dots denote statistically significantly enriched proteins. Already known USB1 interactors are marked in blue. (C and D) GO Biological Process (C) and GO Cellular Component (D) were performed with ShinyGO v0.741 with P value cutoff (FDR) of 0.05 (18). (E) Reproducibly precipitated proteins not included in the volcano plot. Depicted are the four repetitions for each sample. The height of the bars indicates the detected amount. (F) Representative confocal microscopy images for HEK293T cells stably expressing USB1WT or USB1P44L variant (n = 3). Scale bar = 15 µm. To identify only USB1-HA high-intensity signal (left panel), four different labels were used to train the Ilastik machine learning model: high (yellow arrow), medium (green arrow), low (purple arrow), and background (blue arrow). Pixel classification for the SC-35 signal (right panel) was based on two labels: signal (yellow arrow) and background (blue arrow).
|
