|
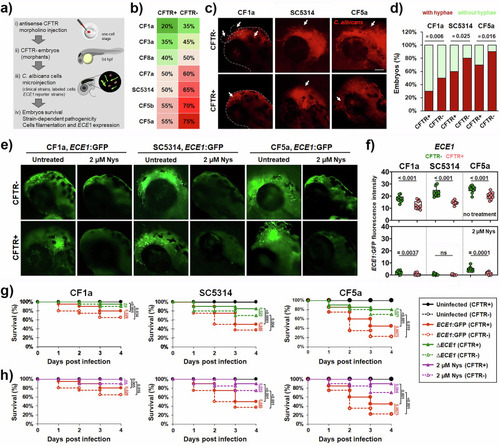
CFTR-deficient zebrafish embryos reveal enhanced Candida albicans virulence, increased ECE1 expression, and decreased therapeutic efficacy of nystatin in vivo. a Schematic overview of the newly developed C. albicans infection model using CFTR-deficient (CFTR-) embryos, generated via CFTR knockdown, to mimic the CF host environment. b Colour-coded map showing the survival rates of CFTR+ and CFTR- embryos (n = 20) at 120 h post-fertilisation (hpf), following infection with C. albicans isolates derived from the sputum of CF patients. c Representative fluorescence images of infected embryos showing extensive hyphal growth (arrow) within tissues and epithelial barrier breaching in the head region (dashed outline). The SC5314 reference strain was used as control. Fungal cells were labelled with a red cell tracker. d Proportion of CFTR- versus CFTR+ embryos with or without visible hyphae in the hindbrain at 24 h post-infection (hpi), assessed by fluorescence microscopy (n = 20). Statistical significance was evaluated using the χ2 test by comparing the distribution of embryos with and without hyphae between CFTR+ and CFTR- groups. e in vivo fluorescence of ECE1:GFP reporter strains upon infection of CFTR- and CFTR⁺ zebrafish embryos, with or without nystatin treatment. f Quantification of GFP fluorescence intensity as a measure of ECE1 expression under the same conditions. g Contribution of ECE1 to C. albicans pathogenicity assessed by Kaplan–Meier survival analysis of CFTR- and CFTR⁺ embryos infected with either ECE1:GFP reporter strains or ECE1 deletion mutants. h Validation of the newly established infection model by assessing the antifungal efficacy of nystatin at 2 µM. Survival differences between CFTR⁺ and CFTR- embryos under each condition were statistically analysed using the log-rank (Mantel–Cox) test. Data for the ECE1:GFP strain are identical in panels g and h, as both analyses were performed within the same experiment. In panel g, ECE1:GFP serves as a reference strain for the deletion mutants, while in panel h it represents the untreated control for the nystatin-treated groups.
|