|
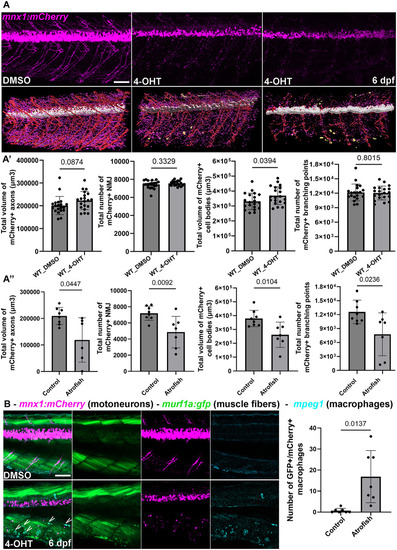
Muscle-specific Atrogin-1 expression affects motoneurons in the central and peripheral nervous system. (A) Confocal projections (top) and 3D reconstructions (bottom) of control or atrofish larvae treated with 4-OHT for 48 hours at 6 dpf. (A’, A”) Analysis of the motoneuron system reveals that motoneurons, axon branching, and neuromuscular connectivity and density (NMJ) are affected in atrofish (DMSO; n = 8 and 4-OHT; n = 7) but not in WT larvae treated with 4-OHT (DMSO; n = 20 and 4-OHT; n = 20). Each biological component was isolated and assigned a unique color label: white (spinal cord), red (axons), magenta (NMJs) and yellow (immune cells mpeg1.2 + macrophages in Fig 3B). Statistical significance was determined by t-test, two-tailed, unpaired with Welch’s correction. (B) Confocal sections of DMSO-treated atrofish larvae (top) or atrofish larvae treated with 4-OHT (bottom) for 48 hours at 6 dpf showing macrophages in close vicinity of the motoneuron axons and NMJ (mnx1:mCherry) in the degenerating muscle tissue (murf1a:GFP). Arrows show mpeg1 + macrophages expressing both GFP and mCherry (DMSO; n = 7 and 4-OHT; n = 7). Statistical significance is determined by t-test, two-tailed, unpaired with Welch’s correction. Error bars represent s.d. Scale bars: 100 μm.
|