|
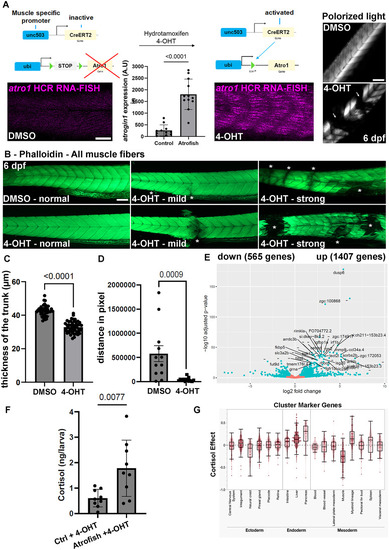
Muscle-specific Atrogin-1 expression leads to muscle atrophy and affects locomotor function in zebrafish larvae. (A) Schematic representation of the method used to express Atrogin-1 in muscle fibers using Tg(503unc:creERT2) and Tg(ubi:Lox-stop-Lox-atrogin1) transgenic lines (atrofish larvae). Efficient recombination of the loxP sites following 4-OHT treatment leads to Atrogin-1-overexpression-dependent muscle atrophy and degeneration, visualized by birefringence analysis using polarized light. Statistical significance is determined Mann-Whitney test. (B) Phalloidin incorporation in control and atrofish larvae after 72 hours of 4-OHT treatment reveals degenerative phenotypes in trunk skeletal-muscle tissue. Asterisk shows a site of muscle-fiber degeneration. (C) Quantification of muscle thickness in control (DMSO; n = 43) and atrofish (4-OHT; n = 51) larvae after 24 hours of 4-OHT treatment. Statistical significance is determined by t-test, two-tailed, unpaired. (D) Quantification of locomotor activity in control (DMSO; n = 12) and atrofish (4-OHT; n = 12) larvae for one hour after 24 hours of 4-OHT treatment. Statistical significance is determined by a Mann-Whitney test, two-tailed, unpaired. (E) Graphical representation of bulk RNAseq analysis and variation in gene-expression profiles in control (DMSO-treated) (n = 4; 50 larvae/sample) vs. atrofish (n = 4; 50 larvae/sample) after 24 hours of 4-OHT treatment. (F) Quantification of cortisol expression levels in control larvae (4-OHT-treated; n = 8 with 30 larvae/sample) and 4-OHT-treated atrofish larvae (n = 8 with 30 larvae/sample) larvae. Statistical significance is determined by t-test, two-tailed, unpaired. (G) Graphical representation of RNAseq analysis and variation in the cell populations based on gene-expression profiles in control vs. cortisol-treated. To map the effects of cortisol exposure to cell and tissue type, marker genes and cell types were identified within the clusters by matching the annotations from the full embryo atlas to the 5 dpf single-cell data (see method for details). Each differentially expressed gene is represented as a dot within the cluster. Error bars represent s.d. Scale bars: 100 μm.
|