|
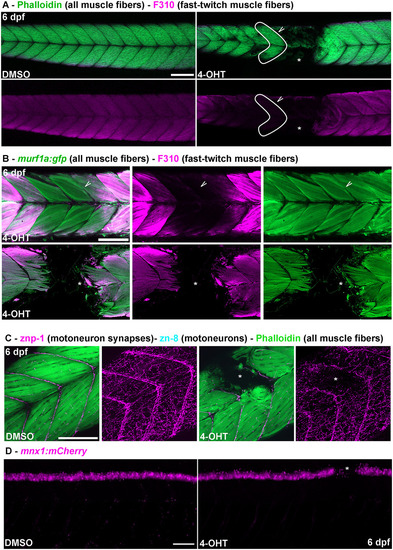
Muscle-specific Atrogin-1 expression leads to myosin light-chain degradation and neuromuscular degeneration in atrofish larvae. (A) Apotome sections of DMSO-treated atrofish larvae (left) or atrofish larvae treated with 4-OHT for 24 hours (right) at 6 dpf showing phalloidin incorporation (green) and F310 immunolabelling (purple) in trunk skeletal muscles. White arrow shows phalloidin incorporation in the absence of F310 expression. (B) Confocal sections of atrofish larvae treated with 4-OHT for 24 (top) or 48 (bottom) hours at 6 dpf showing GFP expression from Tg(murf1a:gfp) in muscle fibers (green) and F310 immunolabelling (purple) in trunk skeletal muscles. White arrow shows GFP expression in the absence of F310 expression. (C) Confocal sections of DMSO-treated atrofish larvae (left) or atrofish larvae treated with 4-OHT for 24 hours (right) at 6 dpf showing phalloidin incorporation (green) and znp-1 (purple) immunolabelling in trunk skeletal muscles. (D) Apotome sections of DMSO-treated atrofish larvae (left) or atrofish larvae treated with 4-OHT for 24 hours (right) at 6 dpf showing motoneuron degeneration using the mnx1:mCherry transgenic line. Asterisk indicates the site of degeneration in the spinal cord. Asterisks show sites of muscle-fiber degeneration. Scale bars: 100 μm.
|