|
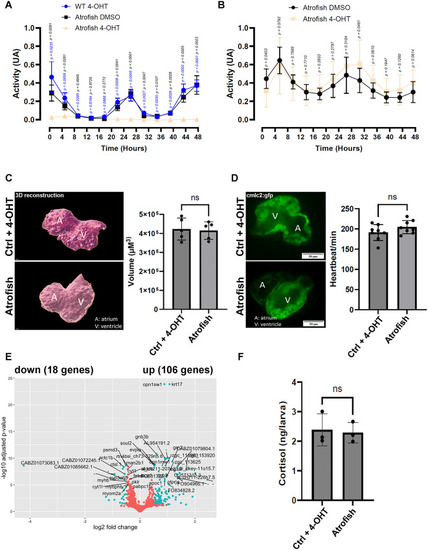
Atrogin-1-dependent muscle dysfunction is reversible in atrofish larvae. (A, B) Quantification of locomotion activity in zebrafish larvae. (A) WT larvae treated with 4-OHT (n = 8) and atrofish larvae treated with DMSO (n = 8) or 4-OHT (n = 8). Larvae were treated with DMSO or 4-OHT for 24 hours between 5 and 6 dpf before the locomotion test, and for 48 hours during the test. The figure shows only the 48-hour test results. (B) Atrofish larvae treated with DMSO or 4-OHT. Larvae were treated with DMSO (n = 12) or 4-OHT (n = 11) for 24 hours between 5 and 6 dpf before the locomotion test, and then placed in chemical-free medium for 48 hours during the locomotion test. The figure shows only the 48-hour test results. Statistical significance is determined by multiple t-test comparison with False Discovery Rate and individual variance for each time point, two-tailed, unpaired. (C, D) Quantification of heart volume after 3D reconstruction in control fish (n = 5) or atrofish (n = 5) (C) or heartbeat using the cmlc2:gfp transgene expressed in cardiomyocytes (D) at 6 dpf in control fish (WT fish) (n = 8) or atrofish (n = 8) treated with 4-OHT for 24 hours between 5 and 6 dpf. Statistical significance is determined by multiple t-test, two-tailed, unpaired. (E) Graphical representation of bulk RNAseq analysis and variation in gene-expression profiles in DMSO-treated control larvae (n = 4; 50 larvae/sample) vs. atrofish (n = 4; 50 larvae/sample) after 24 hours of 4-OHT treatment between 5 and 6 dpf, followed by 2 days of recovery until 8 dpf. (F) Quantification of cortisol expression levels in control larvae (4-OHT-treated; n = 3 with 30 larvae/sample n = 30) and 4-OHT-treated atrofish larvae (n = 3 with 30 larvae/sample) after recovery. Statistical significance is determined by t-test, two-tailed, unpaired. Error bars represent s.d. Scale bars: 50 μm.
|