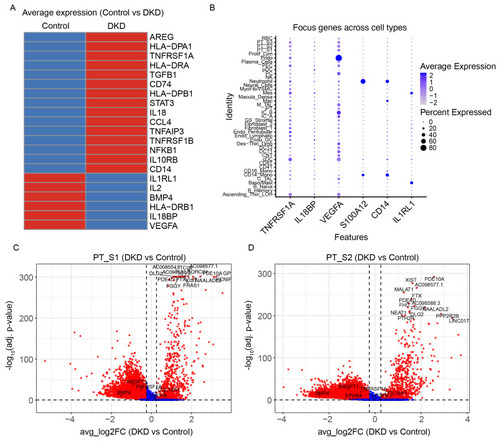
Differential gene expression analysis: (A) Differential average expression genes of DKD and controls. A comparison of the average expression levels of all genes revealed a marked disparity in the DKD group relative to the control group. (B) Single-cell RNA sequencing analysis of focus gene expression in renal cell subtypes from DKD and control samples. The heatmap visualizes the average z-score normalized expression of each gene across annotated cell types. The size of the dots within each tile represents the percentage of cells within that cluster where the gene was detected. Key genes including TNFRSF1A, IL18BP, VEGFA, S100A12, CD14, and IL1RL1 display distinct cell-type-specific patterns. (C) Differential expression analysis of proximal tubule S1 cells in DKD versus control. Volcano plot displaying differentially expressed genes (DEGs) between DKD and control groups. The x-axis represents the average log2 fold change, and the y-axis shows the −log10 adjusted p-value. Red dots indicate significantly upregulated or downregulated genes, while blue dots represent non-significant genes. Selected key genes and top genes are labeled. (D) Differential expression analysis of proximal tubule S2 cells in DKD versus control. Volcano plot displaying differentially expressed genes (DEGs) between DKD and control groups. The x-axis represents the average log2 fold change, and the y-axis shows the −log10 adjusted p-value. Red dots indicate significantly upregulated or downregulated genes, while blue dots represent non-significant genes. Selected key genes and top genes are labeled.
|
