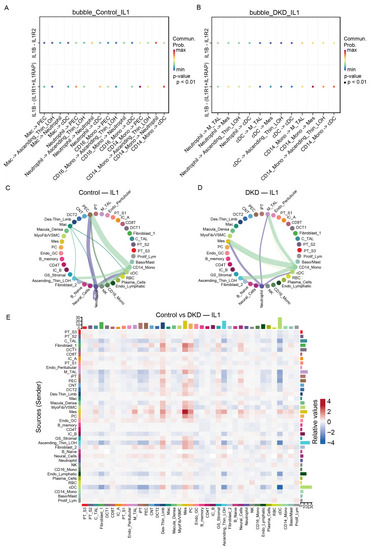
IL-1β signaling network analysis reveals disease-specific reprogramming of inflammatory circuits in DKD: (A) Bubble plot showing inferred IL-1β signaling interactions in control kidneys. Each bubble represents a specific sender–receiver cell pair engaged in IL-1β → IL1R1/IL1RAP signaling based on CellChat analysis. Bubble color indicates communication probability (blue = low, red = high. In controls, CD14+ monocytes primarily signal to dendritic cells (cDC) and parietal epithelial cells (PEC). (B) Bubble plot displaying IL-1β signaling interactions in DKD kidneys. Format identical to panel A. In DKD, IL-1β communication shifts markedly, with CD14+ monocytes predominantly signaling to mesangial cells (Mes) and ascending thin limb of Henle (Ascending_Thin_LOH). (C) Circle plot (chord diagram) depicting the overall IL-1β signaling network structure in control kidneys. Arcs represent sender and receiver cell populations, with edge width proportional to interaction strength. (D) Circle plot showing IL-1β signaling network in DKD kidneys. Format identical to panel C. Compared to controls, DKD exhibits an enhanced and redistributed IL-1β network with increased interaction strength and broader engagement of renal parenchymal cells, particularly tubular and glomerular populations. (E) Heatmap comparing IL-1β signaling strength between control and DKD conditions at the level of all sender–receiver cell pairs. Columns represent sender cell populations, rows represent receiver populations, and color intensity indicates relative change in communication probability (red = increased in DKD, blue = decreased in DKD).
|
