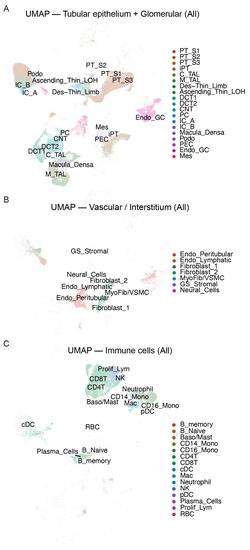
UMAP visualization of single-cell transcriptomes reveals distinct renal cell populations: (A) UMAP plot showing tubular epithelial and glomerular cell populations from control and DKD kidney samples. Distinct clusters represent major renal cell types, including proximal tubule segments (PT_S1, PT_S2, PT_S3, iPT), thick ascending limb (C_TAL, M_TAL), distal convoluted tubule (DCT1, DCT2), collecting duct (CNT, PC, IC_A, IC_B), descending thin limb (Des_Thin_Limb), ascending thin limb of Henle (Ascending_Thin_LOH), macula densa (Macula_Densa), podocytes (Podo), mesangial cells (Mes), glomerular endothelial cells (Endo_GC), and parietal epithelial cells (PEC). Each dot represents a single cell, and colors indicate cell-type identity based on unsupervised clustering and marker gene expression. (B) UMAP plot displaying vascular and interstitial cell populations. Clusters include peritubular endothelial cells (Endo_Peritubular), lymphatic endothelial cells (Endo_Lymphatic), fibroblast subtypes (Fibroblast_1, Fibroblast_2), myofibroblasts/vascular smooth muscle cells (MyoFib/VSMC), glomerular stromal cells (GS_Stromal), and neural cells. (C) UMAP plot illustrating immune cell populations. Major immune subsets include B cells (B_naive, B_memory), plasma cells, T cells (CD4+ T, CD8+ T), proliferating lymphocytes (Proliferating_Lympho), NK cells, monocytes (CD14+ Mono, CD16+ Mono), macrophages (Mac), neutrophils, dendritic cells (cDC, pDC), basophils/mast cells, and red blood cells (RBC). Cell-type annotations were adopted from the original dataset (GSE211785) for consistency.
|
