
Fig. 5
- ID
- ZDB-FIG-251218-16
- Publication
- Ide et al., 2025 - Secreted Frizzled-Related Protein 1a regulates hematopoietic development in a dose-dependent manner
- Other Figures
- All Figure Page
- Back to All Figure Page
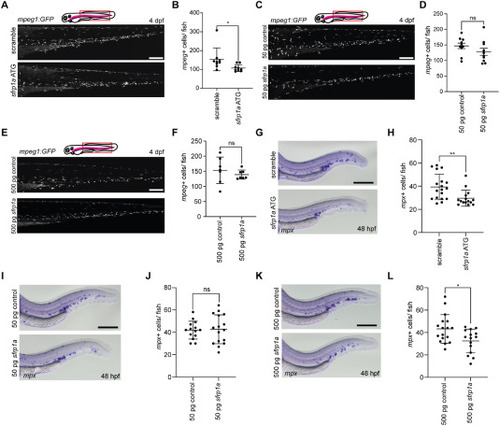
Sfrp1a impacts myeloid differentiation. A. Representative confocal Z-stacks of mpeg1:GFP fish injected with scramble or sfrp1a ATG MO, embedded in agar at 4 dpf and imaged at 25X. Scale bar = 200 μm. B. Quantification of A marked by GFP + cells (n = 9 biological replicates). Each dot represents the mean number of cells in a biological replicate, the bars represent the mean and the error bars represent the standard deviation. Two-tailed Student's, ∗p < 0.05. C. Representative confocal Z-stacks of mpeg1:GFP fish injected with 50 pg control mRNA or 50 pg sfrp1a mRNA, embedded in agar at 4 dpf and imaged at 25X. Scale bar = 200 μm. D. Quantification of C marked by GFP + cells (n = 10 biological replicates). Each dot represents the mean number of cells in a biological replicate, the bars represent the mean and the error bars represent the standard deviation. Two-tailed Student's. E. Representative confocal Z-stacks of mpeg1:GFP fish injected with 500 pg control mRNA or 500 pg sfrp1a mRNA, embedded in agar at 4 dpf and imaged at 25X. Scale bar = 200 μm. F. Quantification of E marked by GFP + cells (n = 7 biological replicates). Each dot represents the mean number of cells in a biological replicate, the bars represent the mean and the error bars represent the standard deviation. Two-tailed Student's. G. Representative images of embryos injected with scramble or sfrp1a ATG MO, fixed at 48 hpf, and analyzed by WISH for mpx. Scale bar = 125 μm. H. Quantification of G (n = 18 and 15 biological replicates from left to right). Each dot represents the mean number of cells in a biological replicate, the bars represent the mean and the error bars represent the standard deviation. Two-tailed Student's, ∗∗p < 0.01. I. Representative images of embryos injected with 50 pg control mRNA or 50 pg sfrp1a mRNA, fixed at 48 hpf, and analyzed by WISH for mpx. Scale bar = 125 μm. J. Quantification of I (n = 14 and 16 biological replicates from left to right). Each dot represents the mean number of cells in a biological replicate, the bars represent the mean and the error bars represent the standard deviation. Two-tailed Student's. K. Representative images of embryos injected with 500 pg control mRNA or 500 pg sfrp1a mRNA, fixed at 48 hpf, and analyzed by WISH for mpx. Scale bar = 125 μm. L. Quantification of K (n = 17 and 15 biological replicates from left to right). Each dot represents the mean number of cells in a biological replicate, the bars represent the mean and the error bars represent the standard deviation. Two-tailed Student's, ∗p < 0.05. |
Reprinted from Developmental Biology, , Ide, A.D., Carpenter, K.A., Elaswad, M.T., Opria, K., Marcellin, K., Gilliland, C., Grainger, S., Secreted Frizzled-Related Protein 1a regulates hematopoietic development in a dose-dependent manner, , Copyright (2025) with permission from Elsevier. Full text @ Dev. Biol.